
Compare / Claude Sonnet 5.5 vs Gemini 4 Argon
Claude Sonnet 5.5 vs Gemini 4 Argon
Which is cheaper, which is more capable, and which does better at each kind of work, from 78 results on 6 sources that measured both models.


Of the 78 results both models have, the better value on each. Results whose reported ranges overlap are too close to call.
Results as of 14 October 2026 (catalogue release 2026-10-14-7d7cf32c3f6d). See also Anthropic vs Google, every model from both labs.
Claude Sonnet 5.5 or Gemini 4 Argon? The short answer
Pick Gemini 4 Argon: it scores higher (Spring Prompt overall 75 against 63) and costs less.
- Spring Prompt overall: Claude Sonnet 5.5 63, Gemini 4 Argon 75 (out of 100; how the score works).
- Gemini 4 Argon is cheaper to run: $0.011 against $0.017 per product listing on CatalogBench (36% less).
- Claude Sonnet 5.5 scores higher on the Artificial Analysis Intelligence Index: 56.0 against 52.6.
- Gemini 4 Argon is newer: released 13 Oct 2026, against 28 Sep 2026 for Claude Sonnet 5.5.
- On our own benchmarks, on the results both models have: Claude Sonnet 5.5 does better for decks from an analysis and marketing planning; Gemini 4 Argon for product listings.
- On third-party benchmarks, on the results both models have: Claude Sonnet 5.5 does better for agents and tool use; Gemini 4 Argon for writing and sticking to the facts.
Head to head
Every fact side by side
| Claude Sonnet 5.5 | Gemini 4 Argon | |
|---|---|---|
| Price per million tokens | $2.00 in · $10.00 out | $2.00 in · $10.00 out |
| Blended (3 in : 1 out) | $4.00 | $4.00 |
| Cheapest host, blended | $4.00 (Amazon Bedrock) | – |
| Cost per product listing (CatalogBench) | $0.017 | $0.011 |
| Cached input, per million | $0.20 cached input | – |
| Intelligence Index | 56.0 | 52.6 |
| Spring Prompt overall | 63 | 75 |
| Output speed, tokens a second | 133 | – |
| Context window | 1,000,000 tokens | 1,048,576 tokens |
| Released | 28 Sep 2026 | 13 Oct 2026 (newer) |
| Weights | Closed | Closed |
| Developer based in | the US | the US |
Prices are the developer's list price where we have read it, otherwise the typical host on OpenRouter; see every model's price. Intelligence and speed from Artificial Analysis.
Which is better for what
Each model's rank among the models on sale today, for each kind of work, from our own benchmarks and licensed sources. Further right is better; the better rank is in green.
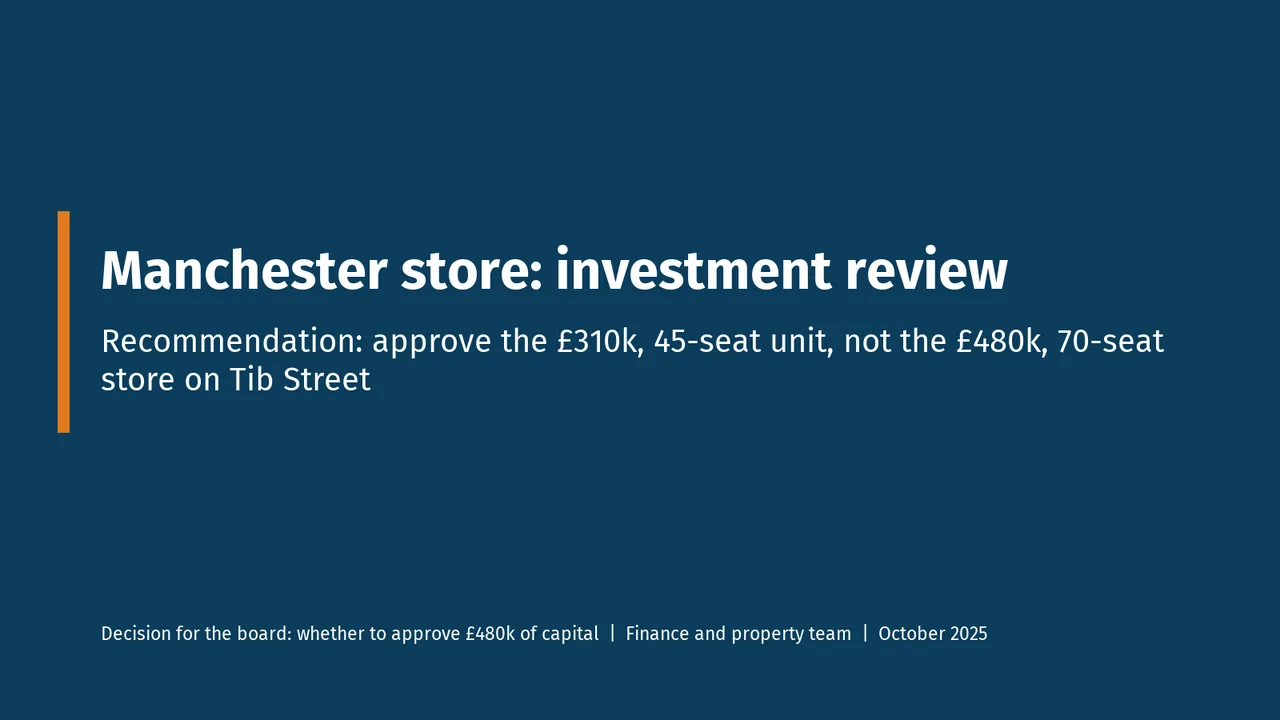
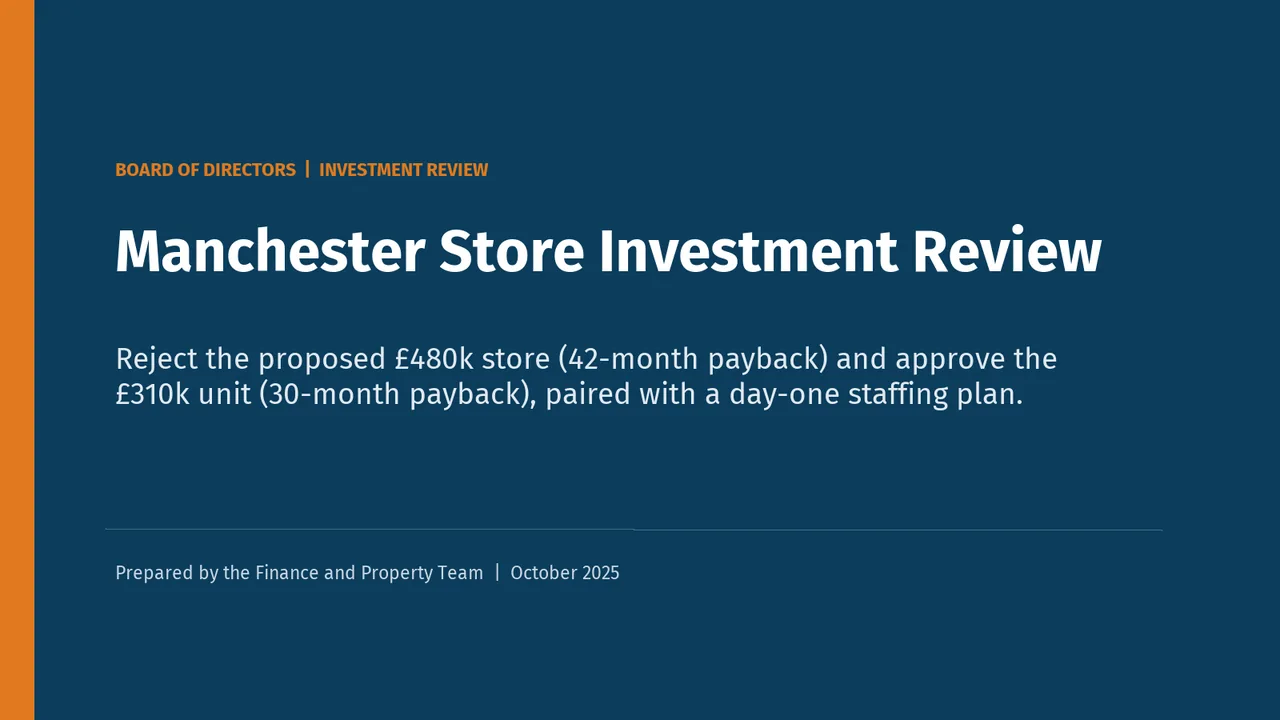
Their slides, side by side
The same brief for both: Manchester store investment review for Hearthside Coffee, an invented company. First slide of each deck from DeckBench.
From our research
Every shared result
Each model's best result on every measure both have, grouped by benchmark, with the setting that produced it. Under each measure, every model that benchmark has measured is a grey tick, best to the right, so you can see where the two sit in the field. The headline measures of each benchmark come first; the rest are under "Show all". Green marks the better value; where a source reports ranges that overlap, neither is marked.
| Measure | Claude Sonnet 5.5 | Gemini 4 Argon |
|---|---|---|
| BulletBench measured by Spring Prompt · 3 results | ||
| Cost per game · Blitz 3+2US dollars, lower is better 9 · 10 of 15 measured | $0.12 | $0.12 |
| Games lost on time · Blitz 3+2% of games, lower is better 8 · 1 of 15 measured | 37.5% | 0.0% |
| Invalid moves · Blitz 3+2% of moves, lower is better 1 · 1 of 15 measured | 0.0% | 0.0% |
| CatalogBench measured by Spring Prompt · 3 results | ||
| Cost per productUS dollars, lower is better 14 · 12 of 22 measured | $0.0172 | $0.0109 |
| Reliably publish-ready% of products, higher is better 14 · 5 of 22 measured | 32.1% | 60.7% |
| Reliably publish-ready · sales brief% of products, higher is better 11 · 9 of 22 measured | 10.7% | 17.9% |
| DeckBench measured by Spring Prompt · 3 results | ||
| Cost per deckUS dollars, lower is better 13 · 10 of 21 measured | $0.15 | $0.11 |
| Deck ratingrating, higher is betterThe rating weighs each win by how strong the other deck was; the win rate counts wins against whichever decks a model happened to meet, so the two can disagree. 5 · 13 of 21 measured | 1,379 | 998 |
| Accurate decks% of tasks, higher is better 6 · 13 of 21 measured | 66.7% | 33.3% |
| ROASBench measured by Spring Prompt · 3 results | ||
| Overall scorescore out of 100, higher is better 4 · 8 of 21 measured | 52.0 | 47.0 |
| Audience scorescore out of 100, higher is better 10 · 8 of 21 measured | 61.8 | 65.5 |
| Business scorescore out of 100, higher is better 2 · 8 of 21 measured | 57.2 | 43.3 |
| Arena (formerly LMArena) reported by Arena (formerly LMArena) · 3 results | ||
| Overall · TextArena rating, higher is better 39 · 1 of 387 measured | 1,471xhigh reasoning | 1,525high reasoning |
| Overall · Text factualityArena rating, higher is better 24 · 1 of 163 measured | 1,470xhigh reasoning | 1,511high reasoning |
| Business, management and finance · TextArena rating, higher is better 46 · 1 of 380 measured | 1,464xhigh reasoning | 1,522high reasoning |
| Artificial Analysis reported by Artificial Analysis · 3 results | ||
| Artificial Analysis Intelligence Indexindex score, higher is better 2 · 5 of 244 measured | 56.0max reasoning | 52.6high reasoning |
| Humanity's Last Exam% of questions, higher is better 5 · 3 of 243 measured | 55.0%max reasoning | 57.1%high reasoning |
| Terminal-Bench 4.0% of tasks, higher is better 1 · 4 of 113 measured | 63.6%max reasoning | 57.1%high reasoning |
Show all 78 results (60 more)
| Measure | Claude Sonnet 5.5 | Gemini 4 Argon |
|---|---|---|
| BulletBench measured by Spring Prompt · 2 results | ||
| Ladder Elo · Blitz 3+2ladder Elo, higher is better 7 · 1 of 15 measured | 557 | 1,147 |
| Median move time · Blitz 3+2milliseconds, lower is better 15 · 5 of 15 measured | 8.1 s | 1.9 s |
| CatalogBench measured by Spring Prompt · 28 results | ||
| Channel compliance% of products, higher is better 15 · 1 of 22 measured | 99.4% | 100.0% |
| Channel rules broken% of products, lower is better 18 · 1 of 22 measured | 1.2% | 0.0% |
| Channel rules broken · sales brief% of products, lower is better 11 · 1 of 22 measured | 0.6% | 0.0% |
| Claims to check% of products, lower is better 1 · 1 of 22 measured | 0.0% | 0.0% |
| Claims to check · sales brief% of products, lower is better 13 · 1 of 22 measured | 0.6% | 0.0% |
| Conflicts caught% of conflicts, higher is better 1 · 1 of 22 measured | 100.0% | 100.0% |
| Content quality% of checks, higher is better 15 · 4 of 22 measured | 96.5% | 98.2% |
| Content quality · sales brief% of checks, higher is better 11 · 4 of 22 measured | 97.3% | 98.4% |
| Decision accuracy% of decisions, higher is better 15 · 5 of 22 measured | 95.7% | 97.8% |
| Failed outputs% of products, lower is better 1 · 1 of 22 measured | 0.0% | 0.0% |
| Failed outputs · sales brief% of products, lower is better 1 · 1 of 22 measured | 0.0% | 0.0% |
| Field accuracy% of missing fields, higher is better 19 · 3 of 22 measured | 91.5% | 94.7% |
| Invented values% of filled values, lower is better 7 · 14 of 22 measured | 0.8% | 1.7% |
| Missing UK information% of products, lower is better 1 · 1 of 22 measured | 0.0% | 0.0% |
| Missing UK information · sales brief% of products, lower is better 1 · 1 of 22 measured | 0.0% | 0.0% |
| Not findable% of products, lower is better 1 · 3 of 22 measured | 1.2% | 2.4% |
| Not findable · sales brief% of products, lower is better 1 · 2 of 22 measured | 0.6% | 1.8% |
| Publish-ready listings% of products, higher is better 16 · 5 of 22 measured | 46.4% | 70.8% |
| Publish-ready listings · sales brief% of products, higher is better 12 · 8 of 22 measured | 27.4% | 35.1% |
| Time per productseconds, lower is better 7 · 3 of 22 measured | 9.90 | 7.30 |
| Unsupported claimsclaims per product, lower is better 16 · 6 of 22 measured | 1.08 | 0.42 |
| Unsupported claims% of products, lower is better 18 · 9 of 22 measured | 39.3% | 16.1% |
| Unsupported claims · sales briefclaims per product, lower is better 11 · 12 of 22 measured | 1.71 | 1.98 |
| Unsupported claims · sales brief% of products, lower is better 10 · 12 of 22 measured | 59.5% | 63.1% |
| Wrong attributes% of products, lower is better 14 · 6 of 22 measured | 19.1% | 15.5% |
| Wrong attributes · sales brief% of products, lower is better 18 · 7 of 22 measured | 20.8% | 15.5% |
| Wrong category or variant% of products, lower is better 14 · 4 of 22 measured | 3.0% | 1.8% |
| Wrong category or variant · sales brief% of products, lower is better 15 · 4 of 22 measured | 3.0% | 1.8% |
| DeckBench measured by Spring Prompt · 14 results | ||
| Caveat dropped% of tasks, lower is better 12 · 1 of 21 measured | 16.7% | 0.0% |
| Clean layout% of tasks, higher is better 1 · 13 of 21 measured | 100.0% | 33.3% |
| Design quality% of the maximum, higher is better 4 · 16 of 21 measured | 78.5% | 55.2% |
| Draft figure quoted% of tasks, lower is better 1 · 17 of 21 measured | 0.0% | 50.0% |
| Findings missing% of tasks, lower is better 1 · 1 of 21 measured | 0.0% | 0.0% |
| Head-to-head win rate% of comparisons, higher is betterThe rating weighs each win by how strong the other deck was; the win rate counts wins against whichever decks a model happened to meet, so the two can disagree. 4 · 13 of 21 measured | 85.6% | 57.0% |
| Layout defects% of tasks, lower is better 1 · 13 of 21 measured | 0.0% | 66.7% |
| Misleading metric used% of tasks, lower is better 1 · 1 of 21 measured | 0.0% | 0.0% |
| Presentable decks% of tasks, higher is better 2 · 12 of 21 measured | 50.0% | 0.0% |
| Recommendation late or wrong% of tasks, lower is better 9 · 1 of 21 measured | 16.7% | 0.0% |
| Slides needing work% of tasks, lower is better 7 · 15 of 21 measured | 33.3% | 66.7% |
| Time per deckseconds, lower is better 8 · 6 of 21 measured | 83.4 | 67.5 |
| Unsupported claims% of tasks, lower is better 1 · 11 of 21 measured | 0.0% | 16.7% |
| Unsupported numbers% of tasks, lower is better 1 · 1 of 21 measured | 0.0% | 0.0% |
| ROASBench measured by Spring Prompt · 6 results | ||
| Consistency scorescore out of 100, higher is better 10 · 5 of 21 measured | 28.5 | 34.7 |
| Contribution profitsimulated US dollars, higher is better 9 · 5 of 21 measured | $571,203 | $673,561 |
| Cost of a runUS dollars, lower is better 13 · 11 of 21 measured | $0.42 | $0.24 |
| Months over budgetmonths of 12, lower is better 1 · 1 of 21 measured | 0 | 0 |
| Planning scorescore out of 100, higher is better 3 · 1 of 21 measured | 55.1 | 55.4 |
| Return on ad spendprofit per $1 spent, higher is better 1 · 8 of 21 measured | $0.70 | $0.55 |
| Arena (formerly LMArena) reported by Arena (formerly LMArena) · 8 results | ||
| Confirmed task success · AgentIPS effect estimate, higher is better 5 · 3 of 48 measured | 0.14max reasoning, arena agent | 0.15high reasoning, arena agent |
| Creative writing · TextArena rating, higher is better 34 · 1 of 385 measured | 1,447xhigh reasoning | 1,519high reasoning |
| Expert prompts · TextArena rating, higher is better 1 · 7 of 338 measured | 1,556xhigh reasoning | 1,539high reasoning |
| Instruction following · TextArena rating, higher is better 15 · 1 of 387 measured | 1,484xhigh reasoning | 1,528high reasoning |
| Praise over complaint · AgentIPS effect estimate, higher is better 5 · 4 of 48 measured | 0.26max reasoning, arena agent | 0.28high reasoning, arena agent |
| Steerability · AgentIPS effect estimate, higher is better 8 · 1 of 48 measured | 0.07max reasoning, arena agent | 0.13high reasoning, arena agent |
| Tool grounding · AgentIPS effect estimate, higher is better 7 · 29 of 48 measured | 0.00max reasoning, arena agent | 0.00high reasoning, arena agent |
| Writing, literature and language · TextArena rating, higher is better 27 · 1 of 386 measured | 1,461xhigh reasoning | 1,522high reasoning |
| Artificial Analysis reported by Artificial Analysis · 2 results | ||
| Long-context reasoning (AA-LCR)% of questions, higher is better 19 · 44 of 234 measured | 82.7%max reasoning | 79.7%high reasoning |
| SciCode% of problems, higher is better 4 · 3 of 114 measured | 61.0%max reasoning | 61.8%high reasoning |
Compare them with other models
- Anthropic vs GoogleEvery model from both labs, best against best
- Claude Sonnet 5.5 vs Claude Opus 5.5Most intelligent at $3–10 per million tokens
- Claude Sonnet 5.5 vs Claude Fable 5.1Just above overall
- Claude Sonnet 5.5 vs Muse Spark 1.3Just below overall
- Gemini 4 Argon vs Claude Opus 5.5Most intelligent at $3–10 per million tokens
- Gemini 4 Argon vs GPT-6 AstraJust above overall
- Gemini 4 Argon vs Muse WonderJust below overall
Quick answers
Is Claude Sonnet 5.5 better than Gemini 4 Argon?
Pick Gemini 4 Argon: it scores higher (Spring Prompt overall 75 against 63) and costs less.
Which is cheaper, Claude Sonnet 5.5 or Gemini 4 Argon?
Gemini 4 Argon is cheaper to run: $0.011 against $0.017 per product listing on CatalogBench (36% less).
Which is better for product listings, Claude Sonnet 5.5 or Gemini 4 Argon?
Gemini 4 Argon ranks 7 of 22 models on sale for turning a sparse product feed and photos into listings that can go live, against 12 for Claude Sonnet 5.5.
Which is better for decks from an analysis, Claude Sonnet 5.5 or Gemini 4 Argon?
Claude Sonnet 5.5 ranks 5 of 21 models on sale for turning a finished analysis into a deck you could present as it is, against 13 for Gemini 4 Argon.
Which is better for marketing planning, Claude Sonnet 5.5 or Gemini 4 Argon?
Claude Sonnet 5.5 ranks 4 of 21 models on sale for planning a year of ad spend without overspending, against 8 for Gemini 4 Argon.
Which is better for agents and tool use, Claude Sonnet 5.5 or Gemini 4 Argon?
Claude Sonnet 5.5 ranks 1 of 166 models on sale for multi-step tasks with tools: support desks, coding agents, function calls, against 3 for Gemini 4 Argon.
Which is better for reasoning and knowledge, Claude Sonnet 5.5 or Gemini 4 Argon?
Claude Sonnet 5.5 ranks 2 of 200 models on sale for hard questions across science, maths and general knowledge, against 3 for Gemini 4 Argon.
Which has the bigger context window, Claude Sonnet 5.5 or Gemini 4 Argon?
Gemini 4 Argon: 1,048,576 tokens, against 1,000,000 for Claude Sonnet 5.5.
Run Claude Sonnet 5.5 and Gemini 4 Argon on your own prompt
Benchmarks aren't your data. Try both side by side in the playground, with the cost of every answer.