
Compare / Claude Haiku 5.5 vs Muse Wonder
Claude Haiku 5.5 vs Muse Wonder
Which is cheaper, which is more capable, and which does better at each kind of work, from 84 results on 5 sources that measured both models.


Of the 84 results both models have, the better value on each. Results whose reported ranges overlap are too close to call.
Results as of 13 October 2026 (catalogue release 2026-10-13-2e2420e3c5cc). See also Anthropic vs Meta, every model from both labs.
Claude Haiku 5.5 or Muse Wonder? The short answer
Pick Muse Wonder if quality matters most: it scores higher (Spring Prompt overall 70 against 42). Pick Claude Haiku 5.5 if cost matters more: it costs 30 times less per product listing on CatalogBench.
- Spring Prompt overall: Claude Haiku 5.5 42, Muse Wonder 70 (out of 100; how the score works).
- Claude Haiku 5.5 is cheaper to run: $0.001 against $0.036 per product listing on CatalogBench (30 times less).
- Muse Wonder is newer: released 12 Oct 2026, against 7 Oct 2026 for Claude Haiku 5.5.
- On our own benchmarks, on the results both models have: Muse Wonder does better for product listings, user surveys and marketing planning.
Head to head
Every fact side by side
| Claude Haiku 5.5 | Muse Wonder | |
|---|---|---|
| Price per million tokens | $0.10 in · $0.50 out | $4.00 in · $20.00 out |
| Blended (3 in : 1 out) | $0.20 | $8.00 |
| Cheapest host, blended | – | – |
| Cost per product listing (CatalogBench) | $0.001 | $0.036 |
| Cached input, per million | – | $0.20 cached input |
| Intelligence Index | 43.4 | – |
| Spring Prompt overall | 42 | 70 |
| Output speed, tokens a second | 235 | – |
| Context window | 1,000,000 tokens | 1,048,576 tokens |
| Released | 7 Oct 2026 | 12 Oct 2026 (newer) |
| Weights | Closed | Closed |
| Developer based in | the US | the US |
Prices are the developer's list price where we have read it, otherwise the typical host on OpenRouter; see every model's price. Intelligence and speed from Artificial Analysis.
Which is better for what
Each model's rank among the models on sale today, for each kind of work, from our own benchmarks and licensed sources. Further right is better; the better rank is in green.
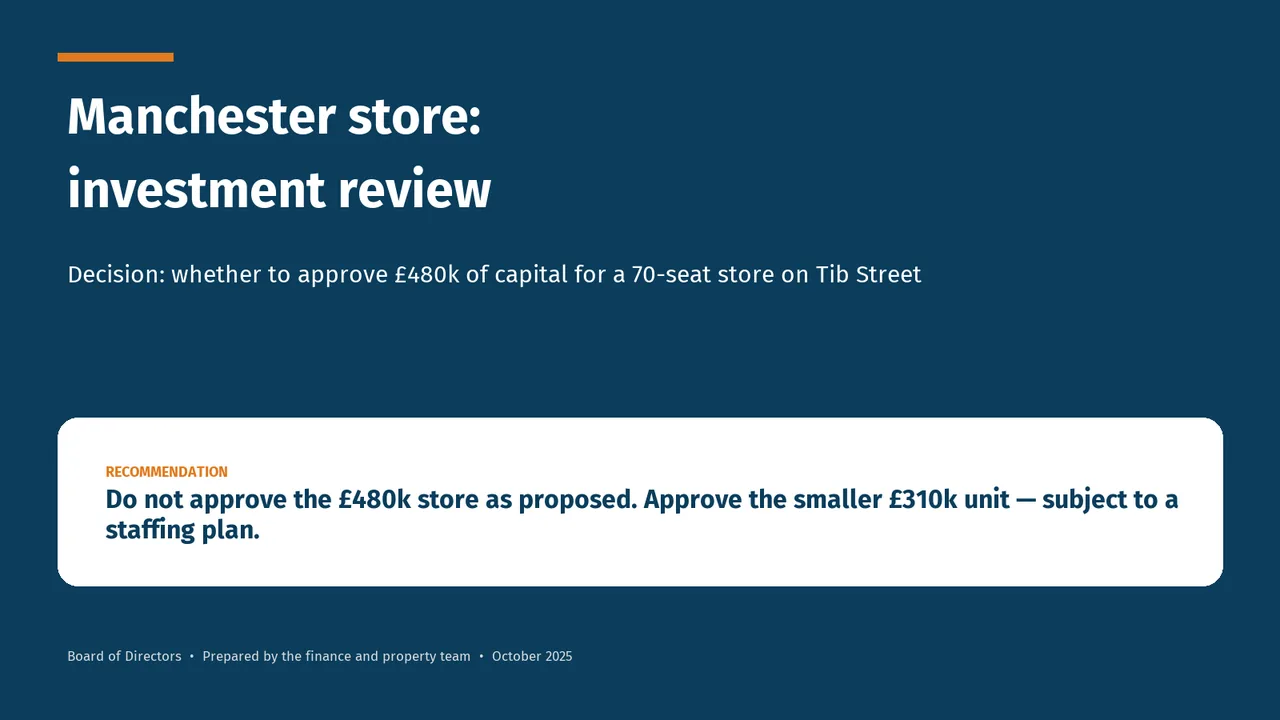
Their slides, side by side
The same brief for both: Manchester store investment review for Hearthside Coffee, an invented company. First slide of each deck from DeckBench.

From our research
- AI Checkpoint: Sol’s new fast lane 9 Oct 2026
- Claude Haiku 5.5 Is Far Better Than Haiku 4.5 at a Tenth of the Price. GPT-6 Luna Still Beats It at Business Work. 8 Oct 2026
- Muse Wonder review: good analysis, work that still needs checking 13 Oct 2026
- We Tested the Anatomy Claude Code Skill on Everyday Objects and Seven AI Models 12 Oct 2026
Every shared result
Each model's best result on every measure both have, grouped by benchmark, with the setting that produced it. Under each measure, every model that benchmark has measured is a grey tick, best to the right, so you can see where the two sit in the field. The headline measures of each benchmark come first; the rest are under "Show all". Green marks the better value; where a source reports ranges that overlap, neither is marked.
| Measure | Claude Haiku 5.5 | Muse Wonder |
|---|---|---|
| BulletBench measured by Spring Prompt · 3 results | ||
| Cost per game · Blitz 3+2US dollars, lower is better 4 · 12 of 14 measured | $0.0164 | $0.27 |
| Cost per game · Bullet 60sUS dollars, lower is better 6 · 28 of 29 measured | $0.0019no reasoning | $0.0663minimal reasoning |
| Ladder Elo · Bullet 60sladder Elo, higher is better 23 · 19 of 29 measured | 310no reasoning | 409minimal reasoning |
| CatalogBench measured by Spring Prompt · 3 results | ||
| Cost per productUS dollars, lower is better 2 · 17 of 21 measured | $0.0012 | $0.0361 |
| Reliably publish-ready% of products, higher is better 15 · 3 of 21 measured | 26.8% | 66.1% |
| Reliably publish-ready · sales brief% of products, higher is better 10 · 4 of 21 measured | 10.7% | 51.8% |
| DeckBench measured by Spring Prompt · 3 results | ||
| Cost per deckUS dollars, lower is better 2 · 14 of 20 measured | $0.0091 | $0.18 |
| Deck ratingrating, higher is betterThe rating weighs each win by how strong the other deck was; the win rate counts wins against whichever decks a model happened to meet, so the two can disagree. 11 · 8 of 20 measured | 1,150 | 1,273 |
| Accurate decks% of tasks, higher is better 13 · 1 of 20 measured | 33.3% | 100.0% |
| ROASBench measured by Spring Prompt · 3 results | ||
| Overall scorescore out of 100, higher is better 18 · 10 of 20 measured | 24.1 | 38.9 |
| Audience scorescore out of 100, higher is better 15 · 12 of 20 measured | 48.4 | 54.7 |
| Business scorescore out of 100, higher is better 16 · 10 of 20 measured | 13.5 | 34.5 |
| SurveyBench measured by Spring Prompt · 3 results | ||
| Analysis ratingrating, higher is betterThe rating weighs each win by how strong the other analysis was; the win rate counts wins against whichever analyses a model happened to meet, so the two can disagree. 4 · 2 of 9 measured | 1,261 | 1,460 |
| Cost per taskUS dollars, lower is better 2 · 8 of 9 measured | $0.0185 | $0.35 |
| Analysis scorepoints of 100, higher is better 4 · 2 of 9 measured | 88.4 | 96.2 |
Show all 84 results (69 more)
| Measure | Claude Haiku 5.5 | Muse Wonder |
|---|---|---|
| BulletBench measured by Spring Prompt · 7 results | ||
| Games lost on time · Blitz 3+2% of games, lower is better 7 · 14 of 14 measured | 37.5% | 75.0% |
| Games lost on time · Bullet 60s% of games, lower is better 17 · 23 of 29 measured | 37.5%no reasoning | 58.3%minimal reasoning |
| Invalid moves · Blitz 3+2% of moves, lower is better 1 · 1 of 14 measured | 0.0% | 0.0% |
| Invalid moves · Bullet 60s% of moves, lower is better 1 · 1 of 29 measured | 0.0%no reasoning | 0.0%minimal reasoning |
| Ladder Elo · Blitz 3+2ladder Elo, higher is better 6 · 13 of 14 measured | 557 | 358 |
| Median move time · Blitz 3+2milliseconds, lower is better 9 · 12 of 14 measured | 6.2 s | 7.1 s |
| Median move time · Bullet 60smilliseconds, lower is better 23 · 25 of 29 measured | 1.7 sno reasoning | 1.9 sminimal reasoning |
| CatalogBench measured by Spring Prompt · 27 results | ||
| Channel compliance% of products, higher is better 1 · 14 of 21 measured | 100.0% | 99.4% |
| Channel rules broken% of products, lower is better 11 · 11 of 21 measured | 0.6% | 0.6% |
| Channel rules broken · sales brief% of products, lower is better 1 · 1 of 21 measured | 0.0% | 0.0% |
| Claims to check% of products, lower is better 14 · 1 of 21 measured | 0.6% | 0.0% |
| Claims to check · sales brief% of products, lower is better 13 · 1 of 21 measured | 1.2% | 0.0% |
| Conflicts caught% of conflicts, higher is better 1 · 1 of 21 measured | 100.0% | 100.0% |
| Content quality% of checks, higher is better 16 · 3 of 21 measured | 95.6% | 98.3% |
| Content quality · sales brief% of checks, higher is better 14 · 3 of 21 measured | 96.3% | 98.5% |
| Decision accuracy% of decisions, higher is better 15 · 3 of 21 measured | 95.6% | 98.3% |
| Failed outputs% of products, lower is better 1 · 1 of 21 measured | 0.0% | 0.0% |
| Failed outputs · sales brief% of products, lower is better 1 · 1 of 21 measured | 0.0% | 0.0% |
| Field accuracy% of missing fields, higher is better 19 · 1 of 21 measured | 91.0% | 96.1% |
| Invented values% of filled values, lower is better 8 · 11 of 21 measured | 0.8% | 1.4% |
| Missing UK information% of products, lower is better 1 · 1 of 21 measured | 0.0% | 0.0% |
| Missing UK information · sales brief% of products, lower is better 1 · 1 of 21 measured | 0.0% | 0.0% |
| Not findable% of products, lower is better 19 · 4 of 21 measured | 11.9% | 3.6% |
| Not findable · sales brief% of products, lower is better 20 · 8 of 21 measured | 10.7% | 3.6% |
| Publish-ready listings% of products, higher is better 14 · 3 of 21 measured | 47.0% | 75.0% |
| Publish-ready listings · sales brief% of products, higher is better 12 · 5 of 21 measured | 20.2% | 67.3% |
| Unsupported claimsclaims per product, lower is better 17 · 4 of 21 measured | 1.20 | 0.21 |
| Unsupported claims% of products, lower is better 14 · 4 of 21 measured | 32.1% | 7.1% |
| Unsupported claims · sales brief% of products, lower is better 13 · 5 of 21 measured | 70.2% | 17.9% |
| Unsupported claims · sales briefclaims per product, lower is better 13 · 5 of 21 measured | 2.46 | 0.36 |
| Wrong attributes% of products, lower is better 14 · 2 of 21 measured | 19.6% | 13.1% |
| Wrong attributes · sales brief% of products, lower is better 11 · 4 of 21 measured | 18.5% | 14.3% |
| Wrong category or variant% of products, lower is better 1 · 10 of 21 measured | 0.0% | 2.4% |
| Wrong category or variant · sales brief% of products, lower is better 1 · 10 of 21 measured | 0.0% | 2.4% |
| DeckBench measured by Spring Prompt · 13 results | ||
| Caveat dropped% of tasks, lower is better 11 · 1 of 20 measured | 16.7% | 0.0% |
| Clean layout% of tasks, higher is better 6 · 18 of 20 measured | 66.7% | 16.7% |
| Design quality% of the maximum, higher is better 13 · 9 of 20 measured | 61.1% | 67.1% |
| Draft figure quoted% of tasks, lower is better 12 · 1 of 20 measured | 33.3% | 0.0% |
| Findings missing% of tasks, lower is better 15 · 1 of 20 measured | 16.7% | 0.0% |
| Head-to-head win rate% of comparisons, higher is betterThe rating weighs each win by how strong the other deck was; the win rate counts wins against whichever decks a model happened to meet, so the two can disagree. 12 · 10 of 20 measured | 58.1% | 63.2% |
| Layout defects% of tasks, lower is better 6 · 18 of 20 measured | 33.3% | 83.3% |
| Misleading metric used% of tasks, lower is better 20 · 1 of 20 measured | 16.7% | 0.0% |
| Presentable decks% of tasks, higher is better 5 · 10 of 20 measured | 33.3% | 16.7% |
| Recommendation late or wrong% of tasks, lower is better 11 · 1 of 20 measured | 33.3% | 0.0% |
| Slides needing work% of tasks, lower is better 2 · 15 of 20 measured | 16.7% | 66.7% |
| Unsupported claims% of tasks, lower is better 14 · 1 of 20 measured | 33.3% | 0.0% |
| Unsupported numbers% of tasks, lower is better 18 · 1 of 20 measured | 16.7% | 0.0% |
| ROASBench measured by Spring Prompt · 6 results | ||
| Consistency scorescore out of 100, higher is better 17 · 12 of 20 measured | 10.6 | 25.9 |
| Contribution profitsimulated US dollars, higher is better 16 · 11 of 20 measured | $32,146 | $489,176 |
| Cost of a runUS dollars, lower is better 3 · 15 of 20 measured | $0.0313 | $0.57 |
| Months over budgetmonths of 12, lower is better 1 · 1 of 20 measured | 0 | 0 |
| Planning scorescore out of 100, higher is better 12 · 4 of 20 measured | 54.8 | 55.0 |
| Return on ad spendprofit per $1 spent, higher is better 16 · 11 of 20 measured | $0.03 | $0.41 |
| SurveyBench measured by Spring Prompt · 16 results | ||
| Head-to-head win rate% of comparisons, higher is betterThe rating weighs each win by how strong the other analysis was; the win rate counts wins against whichever analyses a model happened to meet, so the two can disagree. 4 · 3 of 9 measured | 65.3% | 67.9% |
| Leading or double-barrelled questions% of tasks, lower is better 3 · 5 of 9 measured | 33.3% | 44.4% |
| Mistaken next steps% of tasks, lower is better 4 · 1 of 9 measured | 22.2% | 0.0% |
| Numbers right% of answers, higher is better 1 · 1 of 9 measured | 100.0% | 100.0% |
| Objectives unanswerable% of tasks, lower is better 1 · 5 of 9 measured | 0.0% | 11.1% |
| Precision ignored% of tasks, lower is better 1 · 4 of 9 measured | 0.0% | 22.2% |
| Research scorepoints of 100, higher is better 4 · 3 of 9 measured | 90.2 | 93.6 |
| Sound research% of tasks, higher is better 4 · 3 of 9 measured | 11.1% | 33.3% |
| Stakeholder's view presumed% of tasks, lower is better 1 · 4 of 9 measured | 0.0% | 11.1% |
| Survey plan scorepoints of 100, higher is better 3 · 5 of 9 measured | 94.5 | 87.8 |
| Survey structure% of tasks, lower is better 6 · 8 of 9 measured | 22.2% | 33.3% |
| Traps handled% of traps, higher is better 4 · 1 of 9 measured | 94.2% | 100.0% |
| Traps missed% of tasks, lower is better 2 · 1 of 9 measured | 22.2% | 0.0% |
| Unsupported findings% of tasks, lower is better 5 · 2 of 9 measured | 77.8% | 11.1% |
| Wrong numbers% of tasks, lower is better 1 · 1 of 9 measured | 0.0% | 0.0% |
| Wrong recommendation% of tasks, lower is better 3 · 1 of 9 measured | 11.1% | 0.0% |
Compare them with other models
- Anthropic vs MetaEvery model from both labs, best against best
- Claude Haiku 5.5 vs Claude Opus 5.5Most intelligent available today
- Claude Haiku 5.5 vs Grok 4.7Just above overall
- Claude Haiku 5.5 vs GPT-6 LunaJust below overall
- Muse Wonder vs Claude Opus 5.5Highest-scoring overall at $3–10 per million tokens
- Muse Wonder vs GPT-6 AstraJust above overall
- Muse Wonder vs GPT-6 SolJust below overall
- Muse Wonder vs Muse Spark 1.3Meta's best other model
Quick answers
Is Claude Haiku 5.5 better than Muse Wonder?
Pick Muse Wonder if quality matters most: it scores higher (Spring Prompt overall 70 against 42). Pick Claude Haiku 5.5 if cost matters more: it costs 30 times less per product listing on CatalogBench.
Which is cheaper, Claude Haiku 5.5 or Muse Wonder?
Claude Haiku 5.5 is cheaper to run: $0.001 against $0.036 per product listing on CatalogBench (30 times less).
Which is better for product listings, Claude Haiku 5.5 or Muse Wonder?
Muse Wonder ranks 4 of 21 models on sale for turning a sparse product feed and photos into listings that can go live, against 12 for Claude Haiku 5.5.
Which is better for decks from an analysis, Claude Haiku 5.5 or Muse Wonder?
Muse Wonder ranks 8 of 20 models on sale for turning a finished analysis into a deck you could present as it is, against 11 for Claude Haiku 5.5.
Which is better for user surveys, Claude Haiku 5.5 or Muse Wonder?
Muse Wonder ranks 2 of 9 models on sale for planning a user survey and reading its results without being misled, against 4 for Claude Haiku 5.5.
Which is better for marketing planning, Claude Haiku 5.5 or Muse Wonder?
Muse Wonder ranks 10 of 20 models on sale for planning a year of ad spend without overspending, against 18 for Claude Haiku 5.5.
Which is better for speed under pressure, Claude Haiku 5.5 or Muse Wonder?
Muse Wonder ranks 12 of 24 models on sale for good decisions against a real clock (fast chess), against 17 for Claude Haiku 5.5.
Which has the bigger context window, Claude Haiku 5.5 or Muse Wonder?
Muse Wonder: 1,048,576 tokens, against 1,000,000 for Claude Haiku 5.5.
Run Claude Haiku 5.5 and Muse Wonder on your own prompt
Benchmarks aren't your data. Try both side by side in the playground, with the cost of every answer.