Benchmarks / DeckBench / Lumio
Measured by Spring Prompt
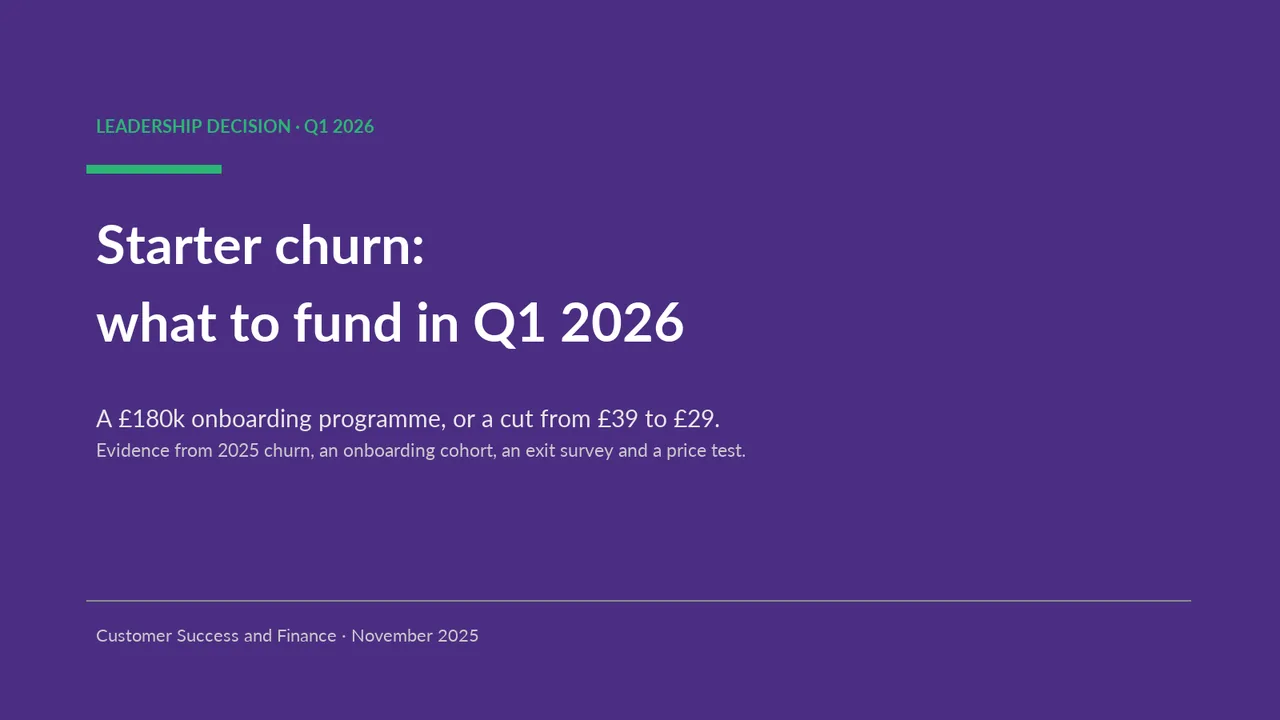
Qwen4 Max: Starter churn: what to fund in Q1 2026
For the leadership team (chief executive, CFO, heads of product, sales and customer success). The decision it supports: whether to fund a Starter price cut or an onboarding programme in Q1 2026.
- Verdict
- Not presentable
- Deck rating
- 1,585
- Slides
- 9 (brief: 6-10)
- Design quality
- 83%
Why it is not presentable
- Layout defect: something off the slide, colliding, too small or too faint to read
- Showed a number the analysis does not support
- Made a material claim the analysis does not support
- A slide the judges rated as needing work
In detail
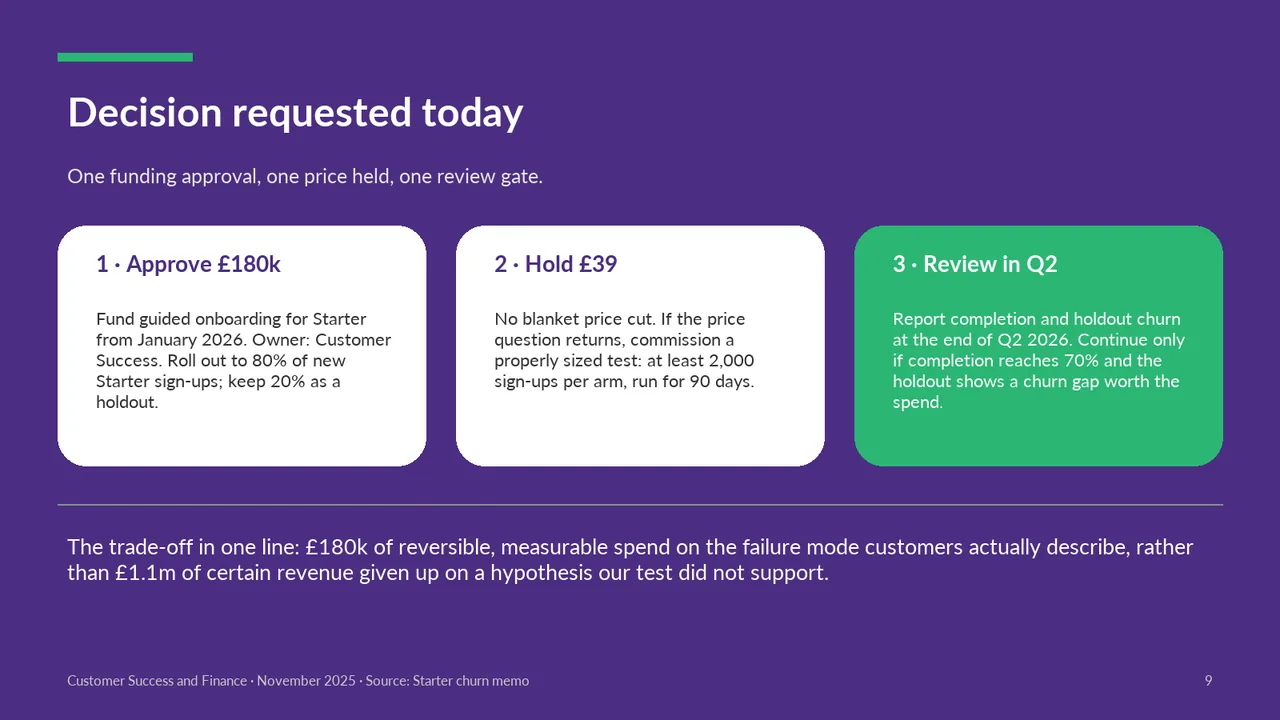
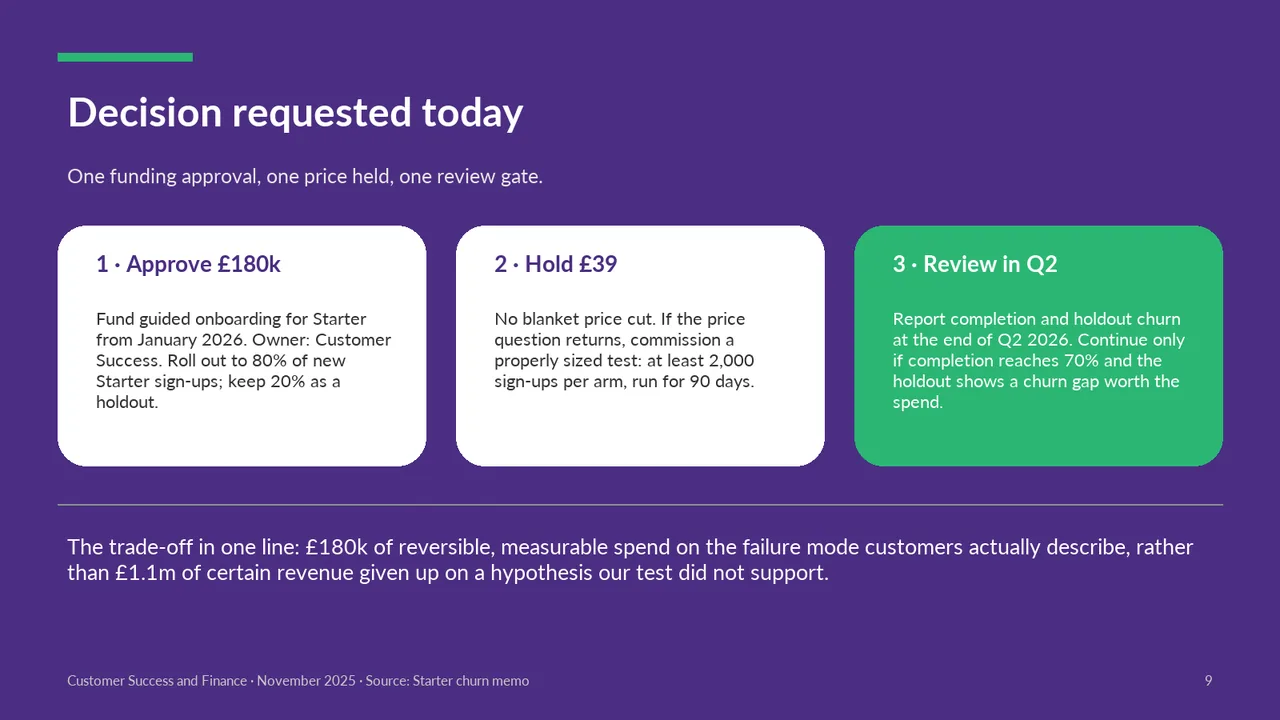
- Not supported by the analysis: slide 9: 80%.
- Not supported by the analysis: slide 9: 20%.
- Not supported by the analysis: slide 9: 70%.
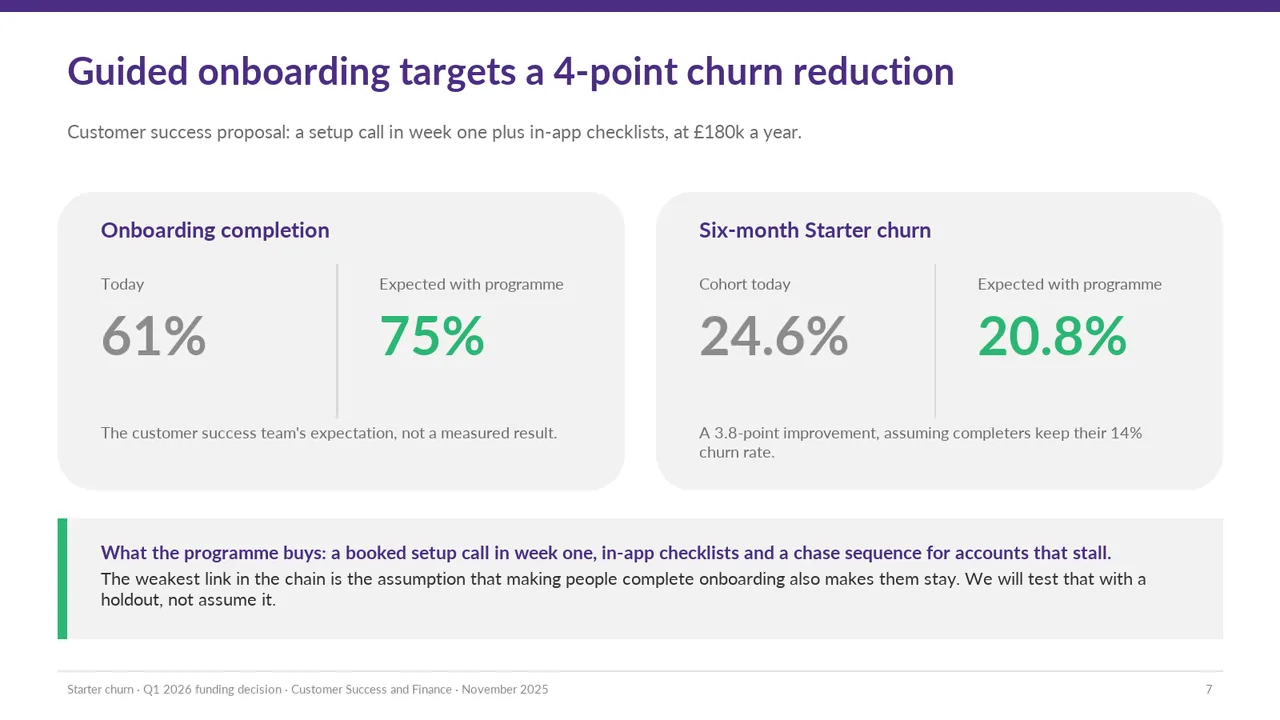
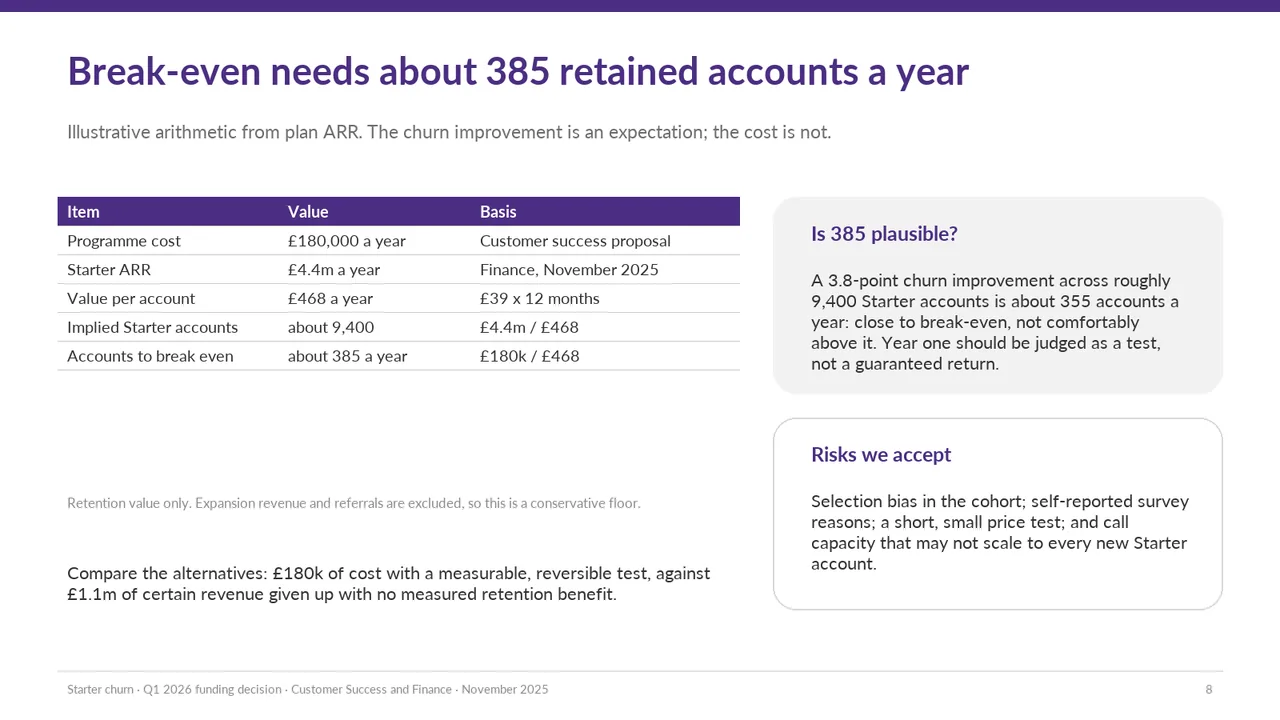
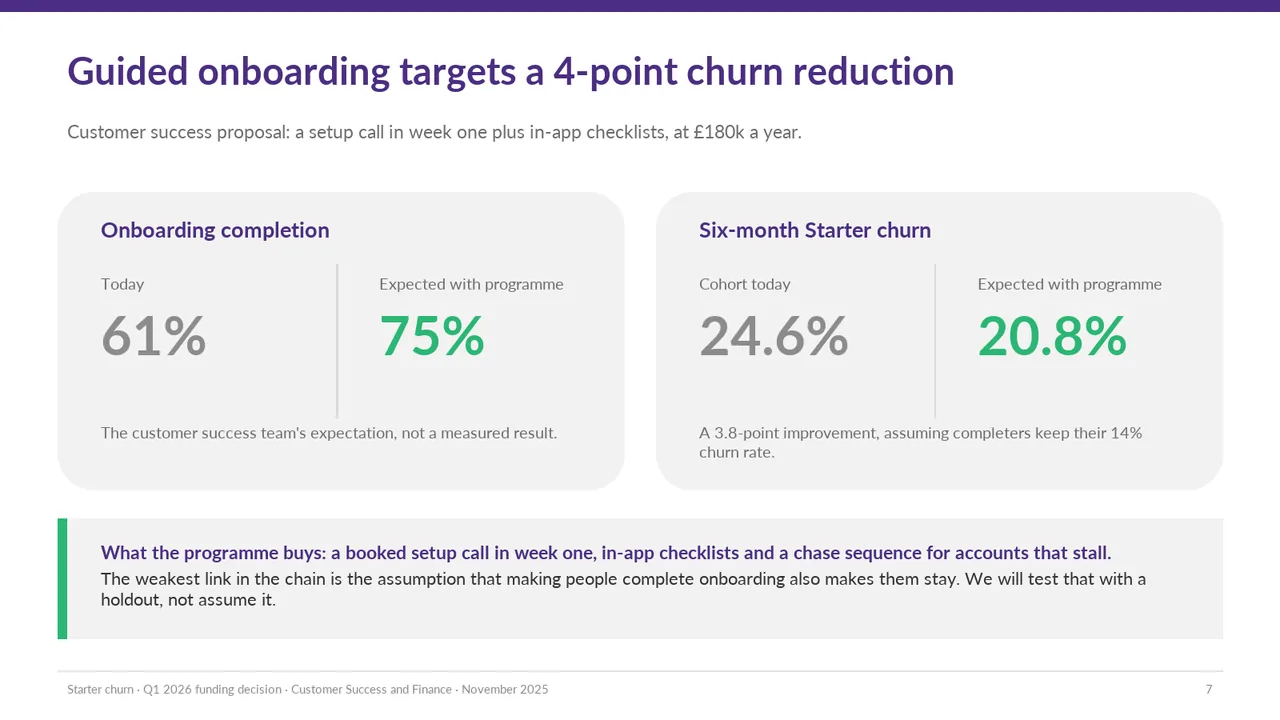
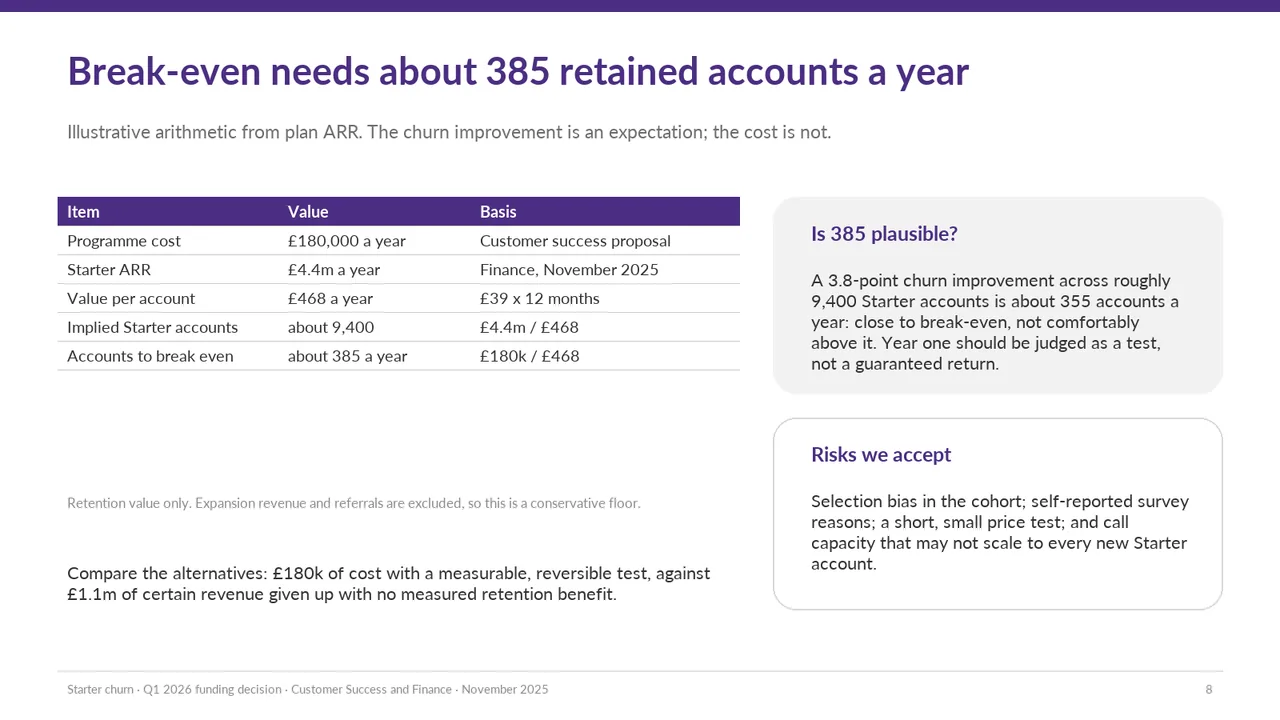
- Slide 8: “A 3.8-point churn improvement across roughly 9,400 Starter accounts is about 355 accounts a year: close to break-even.” is not supported by the analysis.
- Slide 8: “Expansion revenue and referrals are excluded, so this is a conservative floor.” is not supported by the analysis.
- Slide 8: “A 3.8-point churn improvement across roughly 9,400 Starter accounts is about 355 accounts a year: close to break-even. This applies a six-month new-cohort churn change to the whole account base as an annual figure. The analysis makes no payback claim.” is not supported by the analysis.
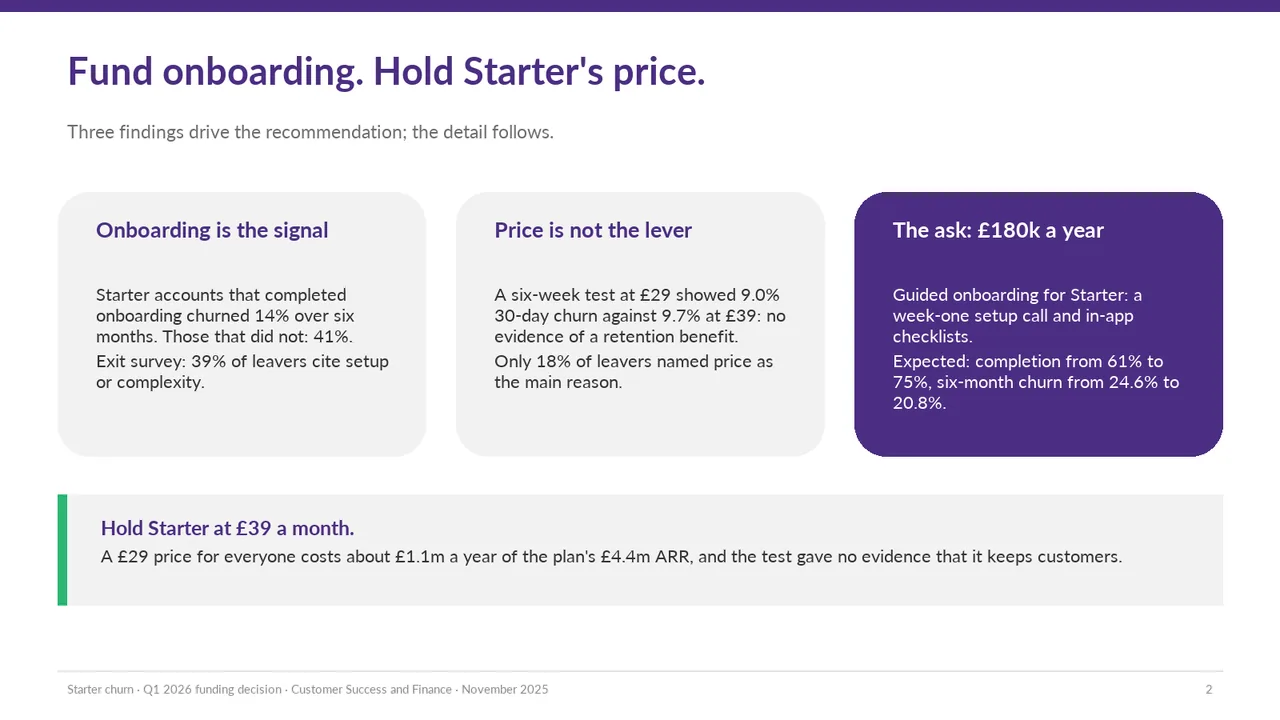
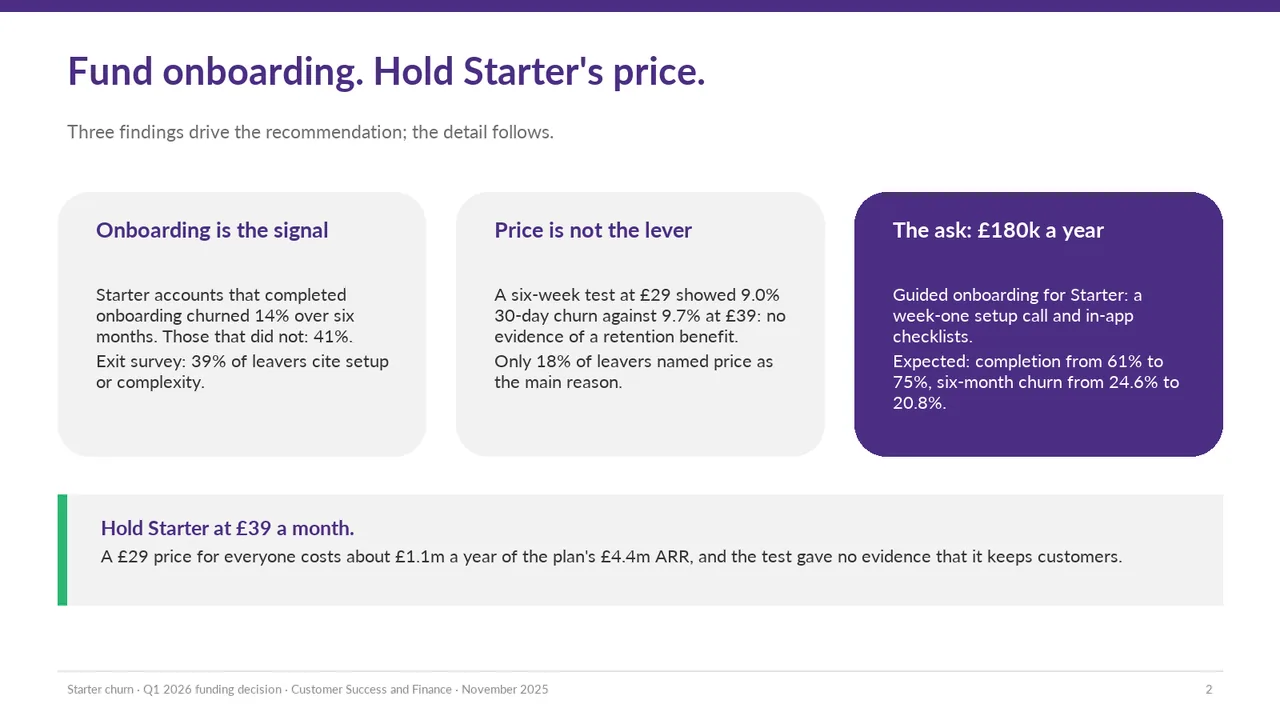
- Slide 2: 2 text boxes set at 9 pt, too small to read