Benchmarks / DeckBench / Lumio

Measured by Spring Prompt

Gemini 4 Neon: Starter churn: what to fund in Q1 2026

For the leadership team (chief executive, CFO, heads of product, sales and customer success). The decision it supports: whether to fund a Starter price cut or an onboarding programme in Q1 2026.

Verdict
Not presentable
Deck rating
1,013
Slides
9 (brief: 6-10)
Design quality
78%

Why it is not presentable

  • Layout defect: something off the slide, colliding, too small or too faint to read
  • Showed a number the analysis does not support
  • Made a material claim the analysis does not support

In detail

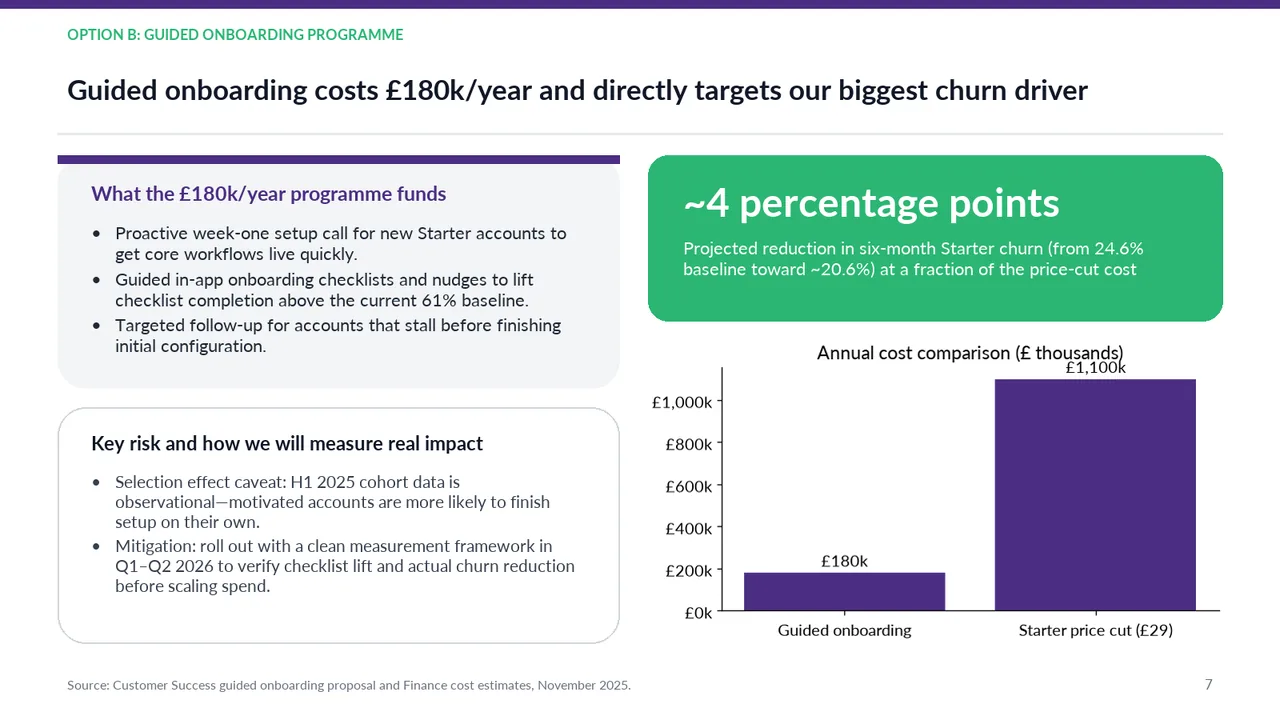
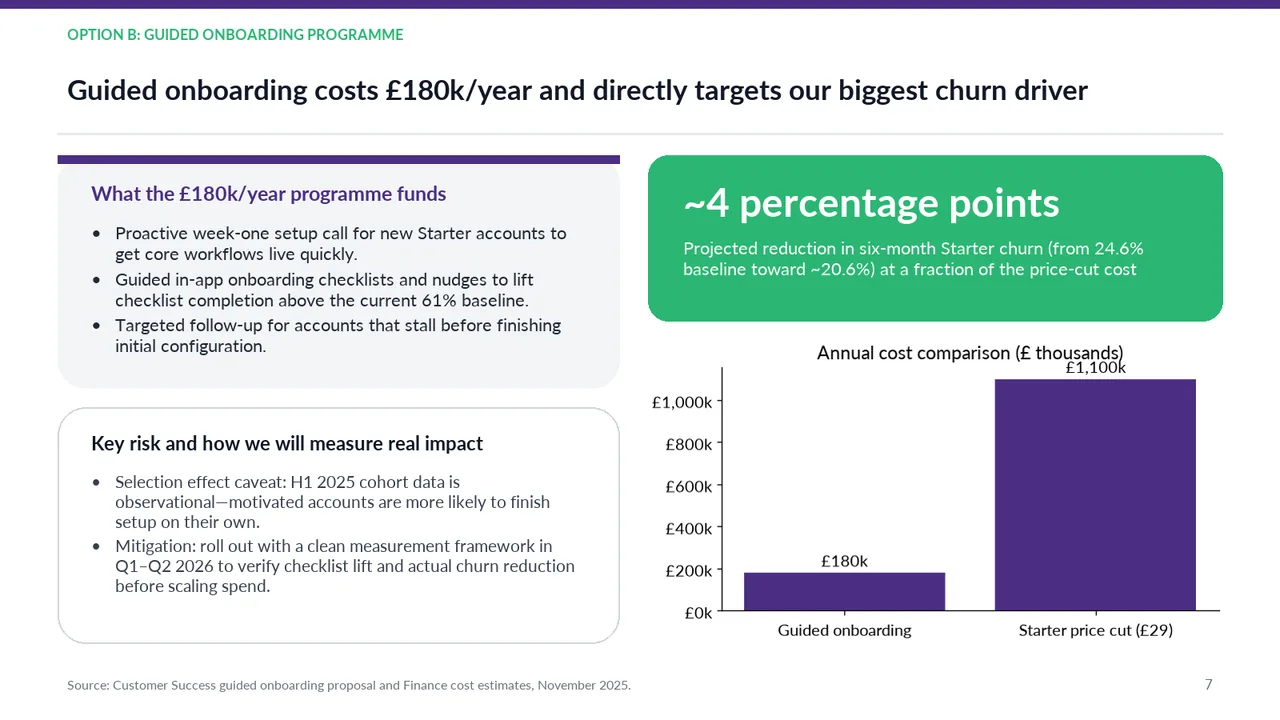
  • Not supported by the analysis: slide 7: 20.6%.
  • Slide 7: “Projected six-month Starter churn falls from 24.6% toward approximately 20.6%.” is not supported by the analysis.
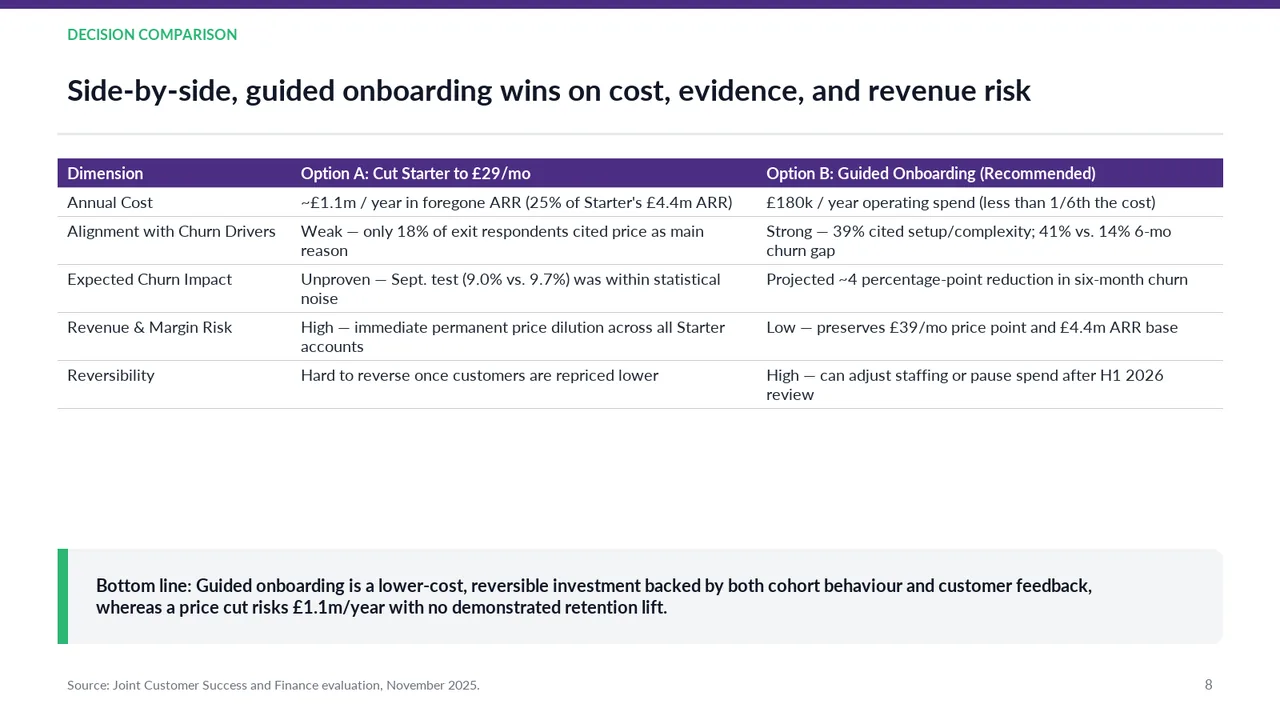
  • Slide 8: “A price cut is hard to reverse once customers are repriced, whereas onboarding is highly reversible through staffing adjustments or pausing spend.” is not supported by the analysis.
  • Slide 7: “Projected reduction in six-month Starter churn (from 24.6% baseline toward ~20.6%)” is not supported by the analysis.
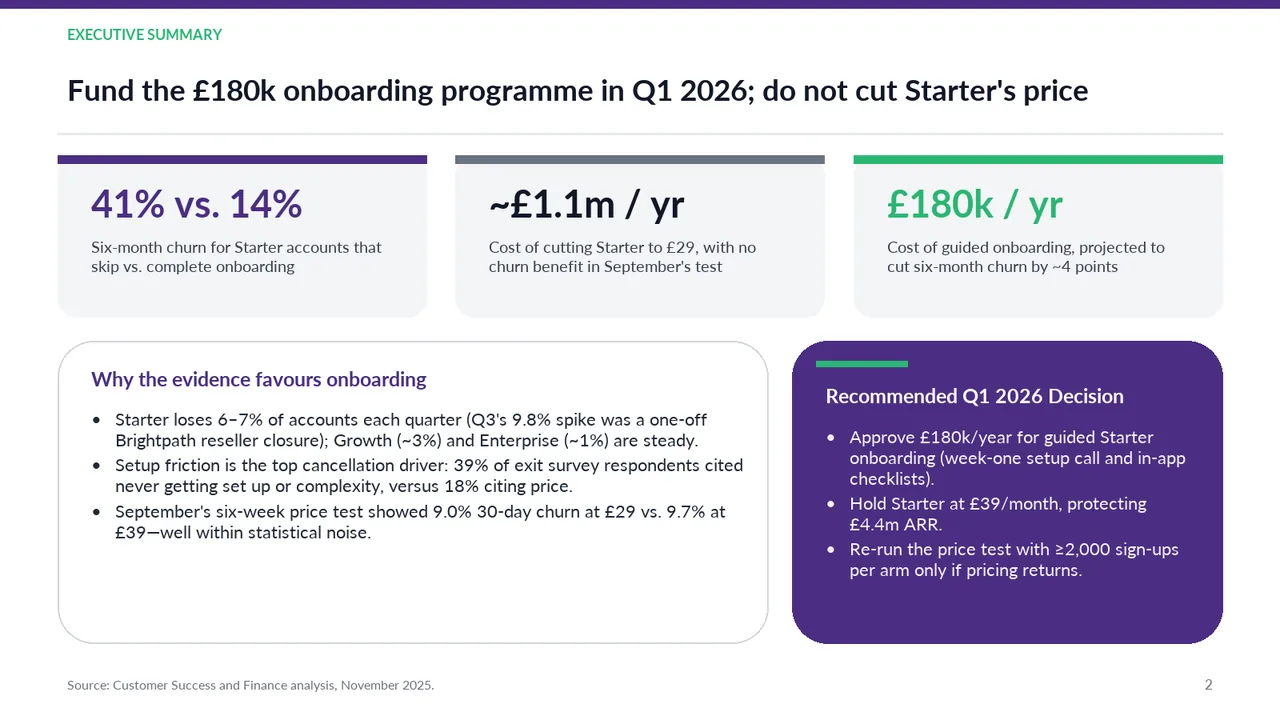
  • Slide 2: A text box set at 9.5 pt, too small to read

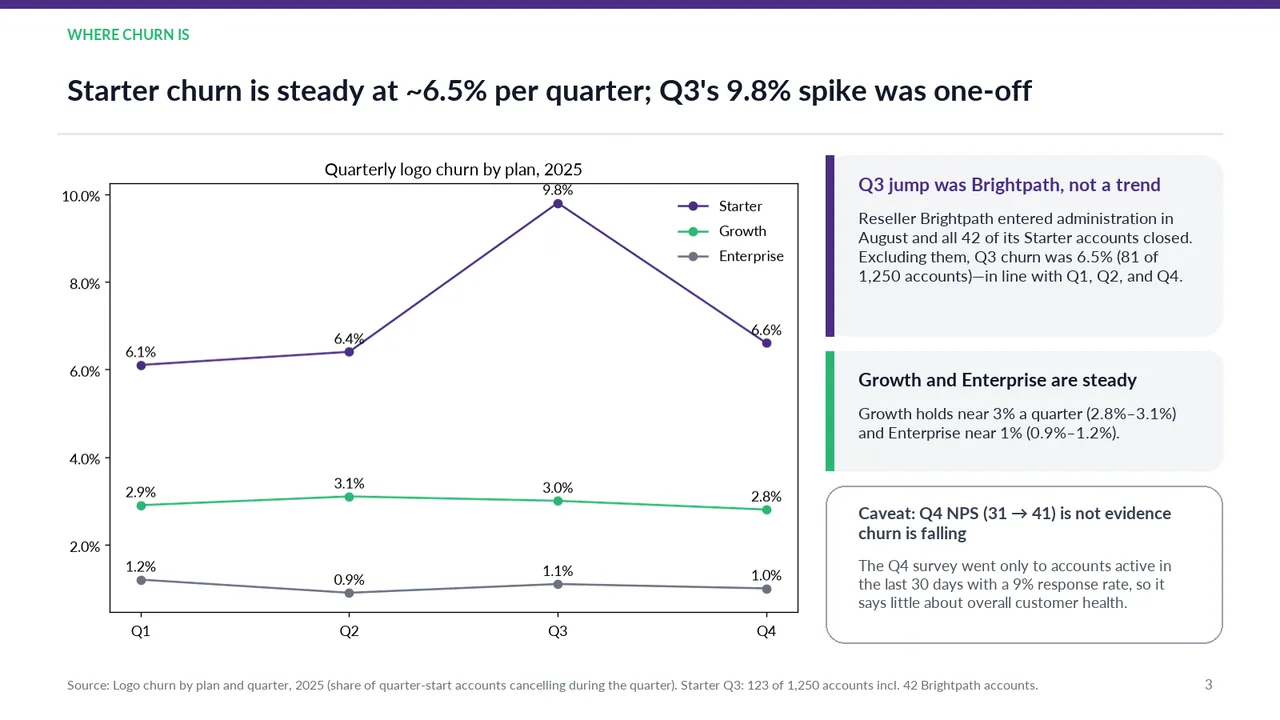
  • Slide 3: A body text box set at 11.5 pt, too small to read
  • Slide 3: A text box set at 9.5 pt, too small to read
  • Slide 4: A text box set at 9.5 pt, too small to read
  1. Slide 1 of Gemini 4 Neon's deck
    Slide 1Download slide imagePolished
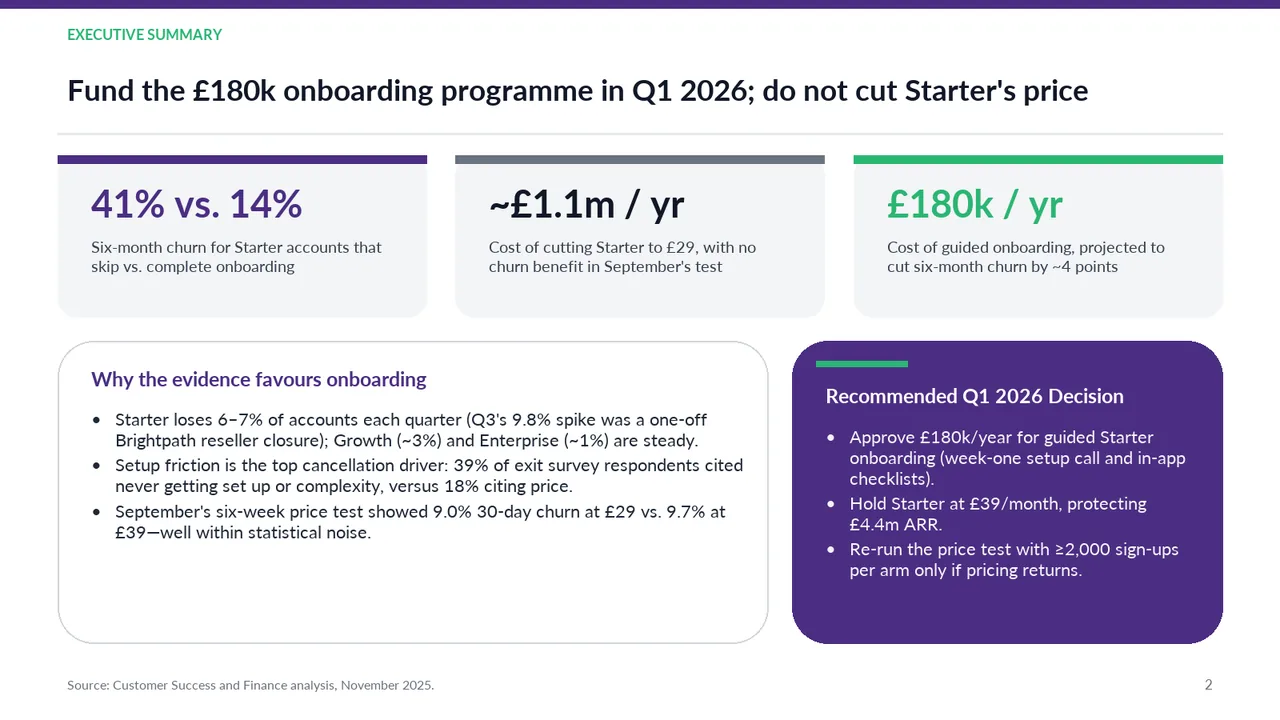
  2. Slide 2 of Gemini 4 Neon's deck
    Slide 2Download slide imagePolished The lower half is text-heavy, with several multiline bullets competing for reading time.
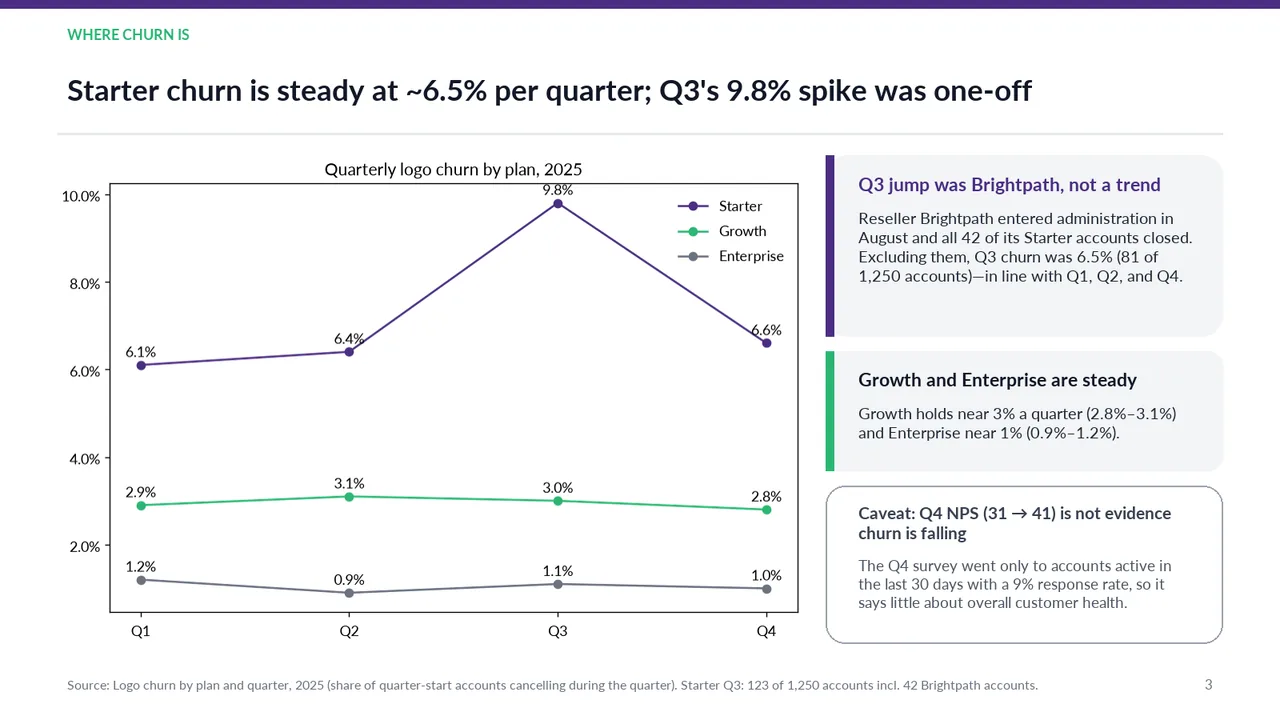
  3. Slide 3 of Gemini 4 Neon's deck
    Slide 3Download slide imagePolished The '9.8%' data label sits on the plot's top border, just under the chart title
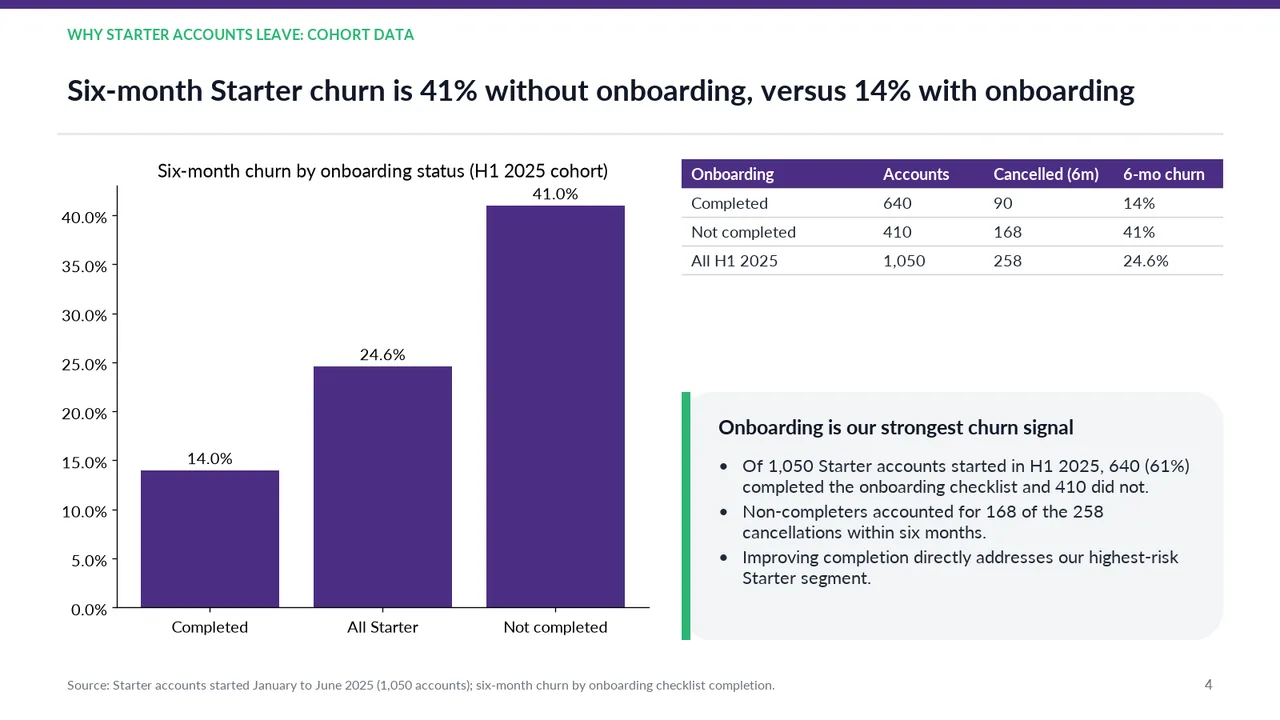
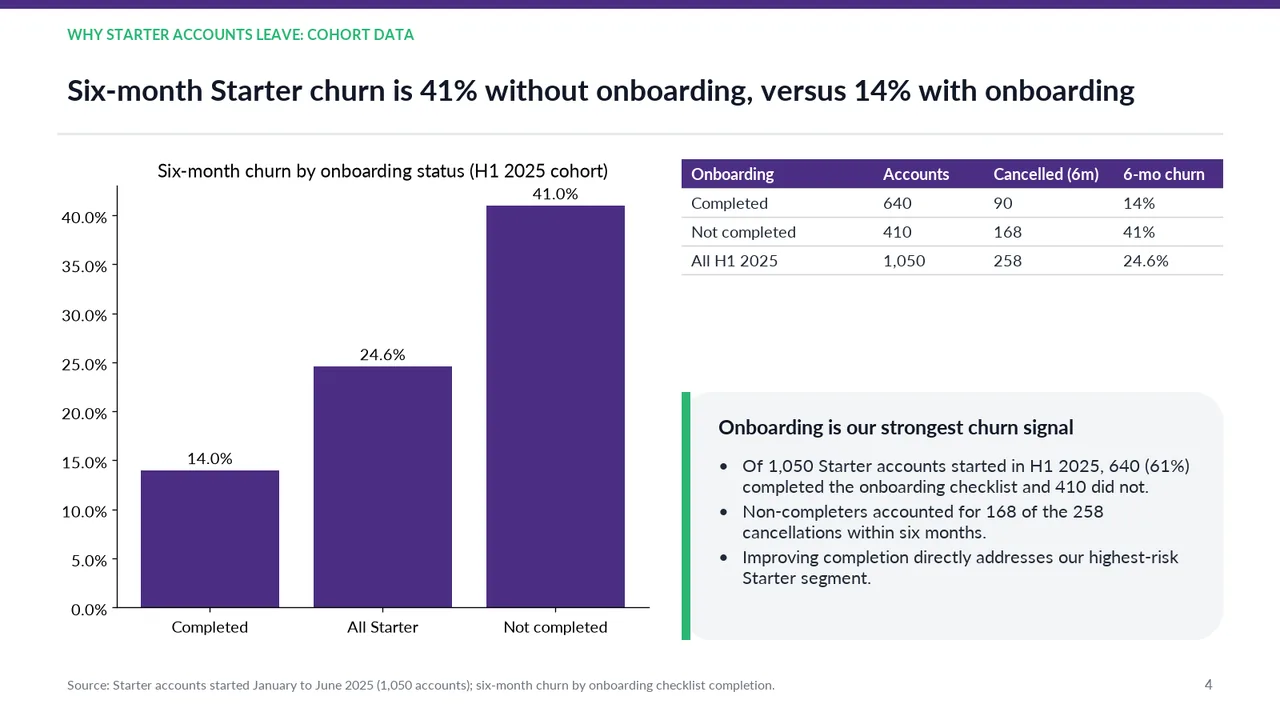
  4. Slide 4 of Gemini 4 Neon's deck
    Slide 4Download slide imageAcceptable The aggregate 'All Starter' bar receives the same colour and emphasis as the two cohorts being compared, weakening the visual focus on 14% versus 41%.Large empty gap between the table and the callout box on the right
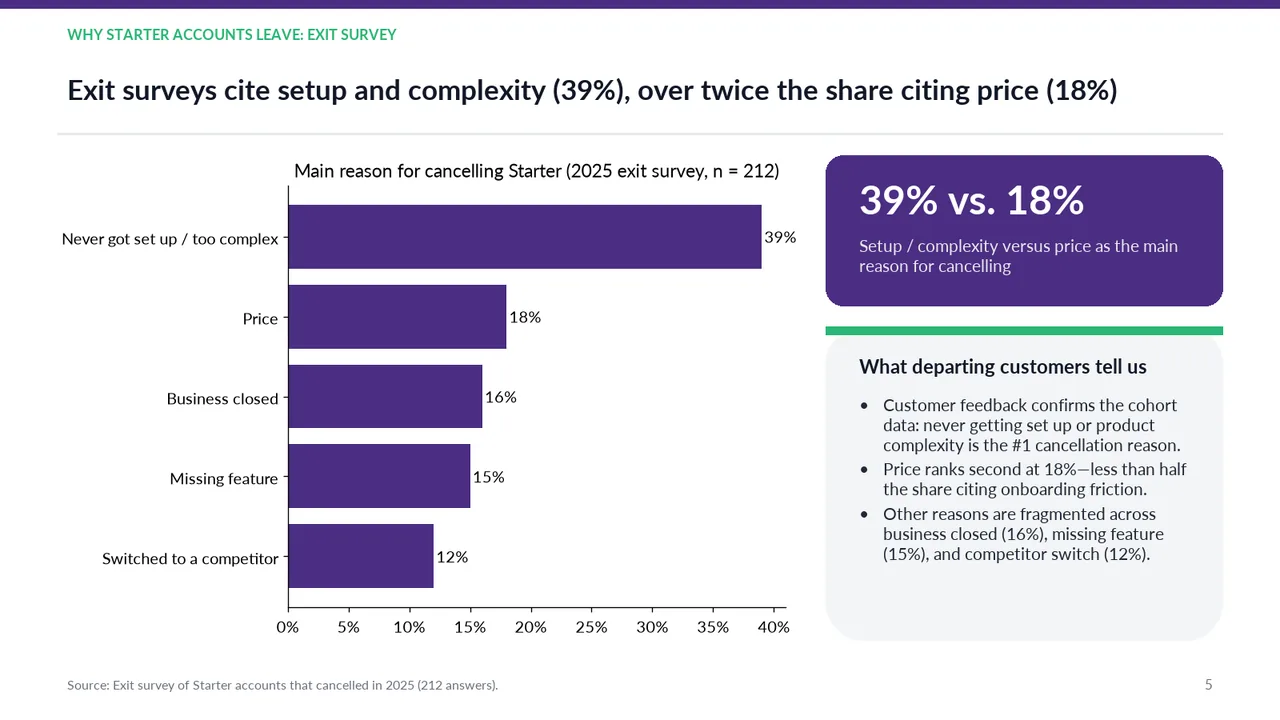
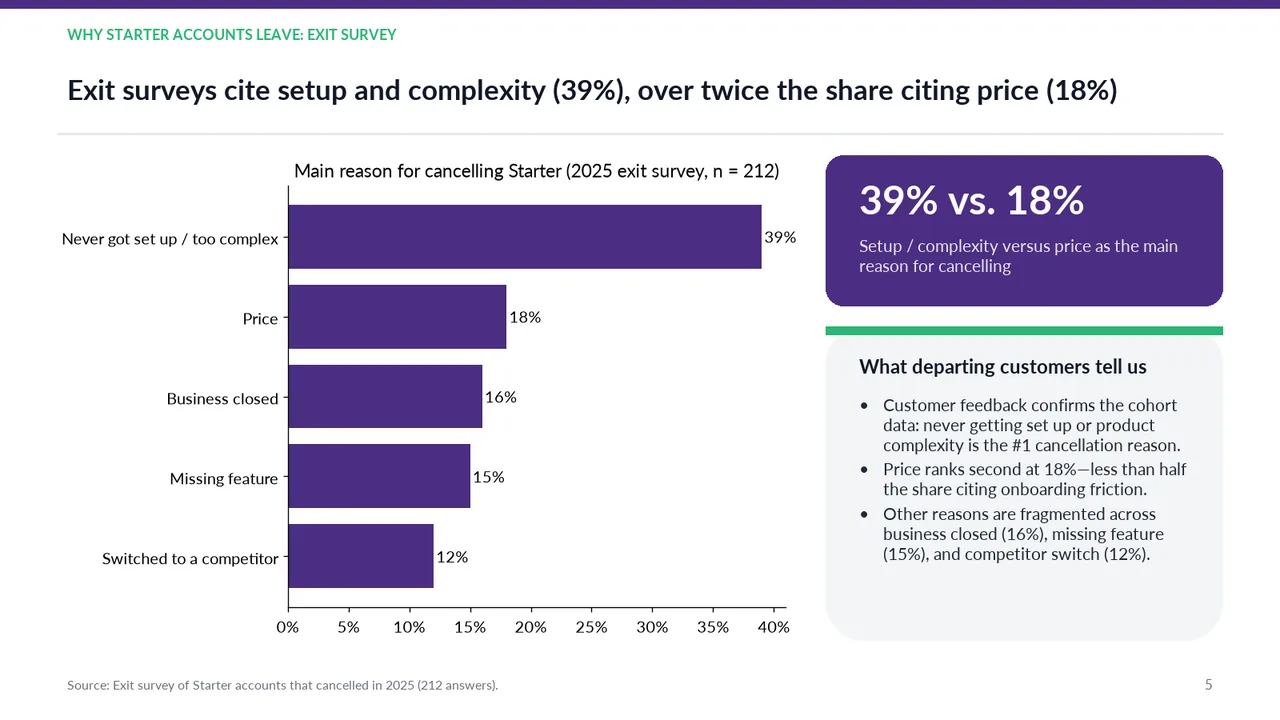
  5. Slide 5 of Gemini 4 Neon's deck
    Slide 5Download slide imagePolished
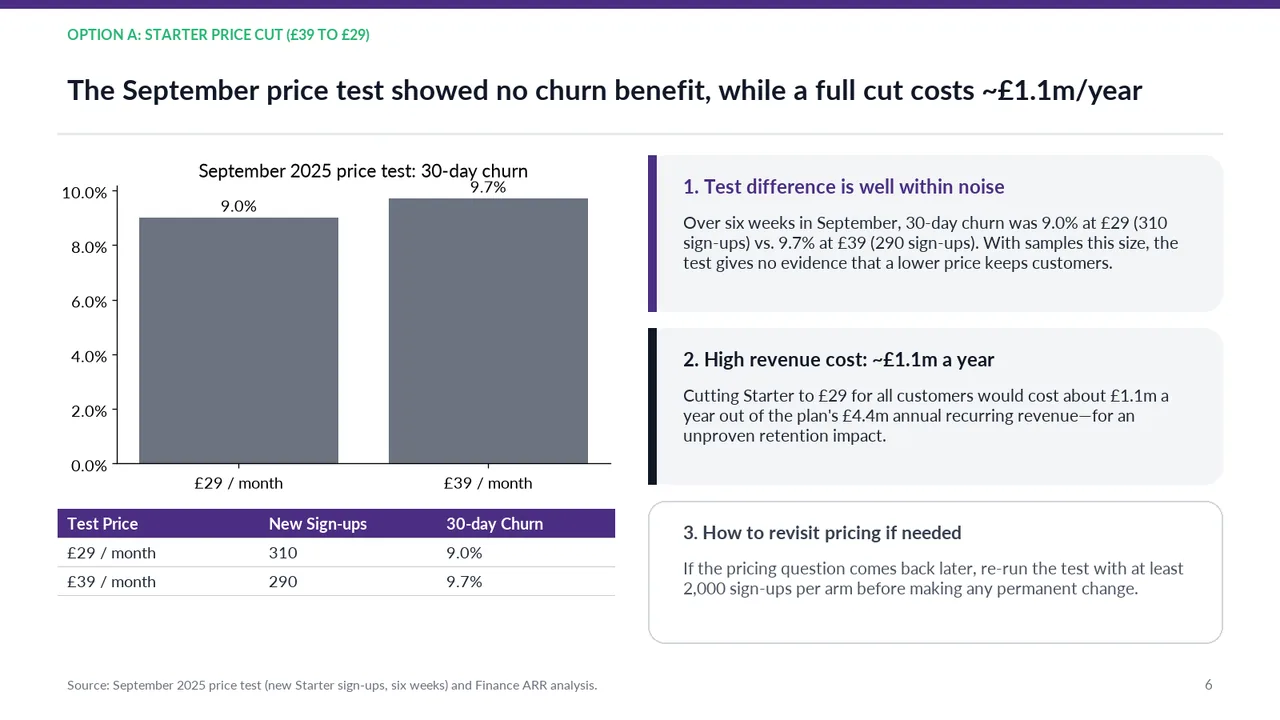
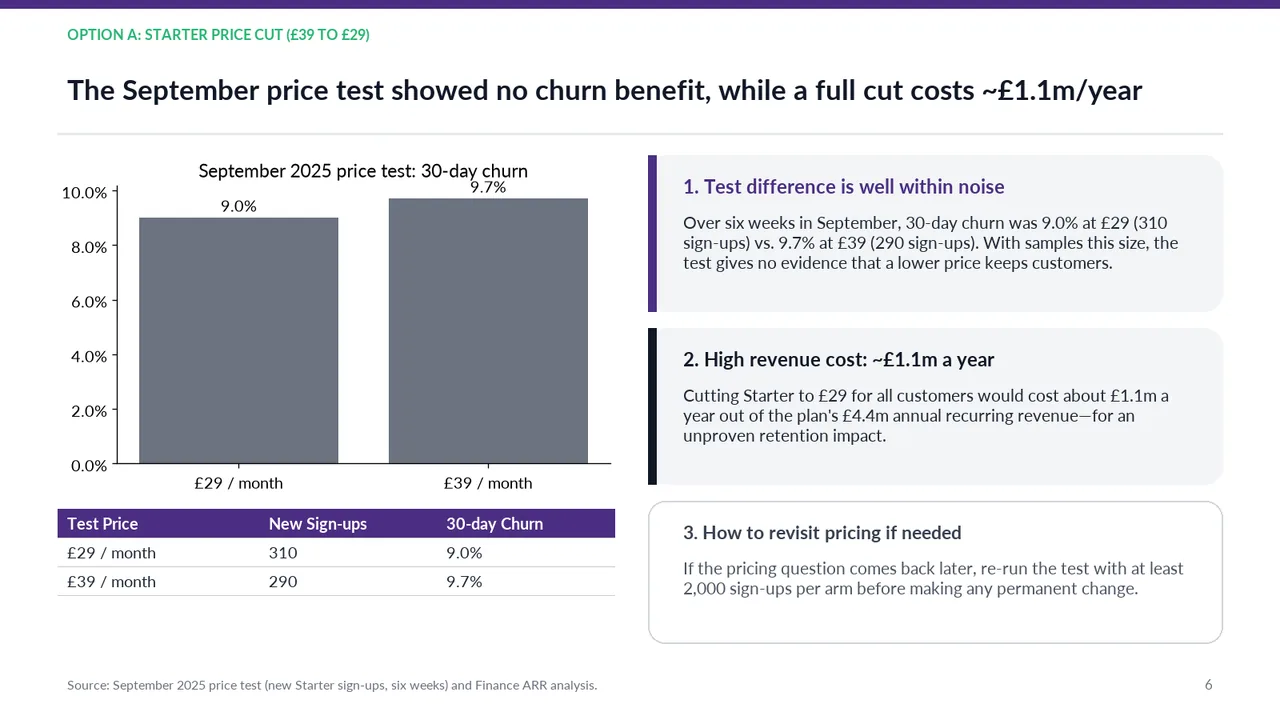
  6. Slide 6 of Gemini 4 Neon's deck
    Slide 6Download slide imageAcceptable Three substantial explanatory panels make the slide text-heavy.The '9.7%' data label collides with the chart title '30-day churn'
  7. Slide 7 of Gemini 4 Neon's deck
    Slide 7Download slide imageAcceptable The chart title and the £1,100k value label are tightly stacked, leaving little separation.The '£1,100k' data label overlaps the chart title 'Annual cost comparison (£ thousands)'
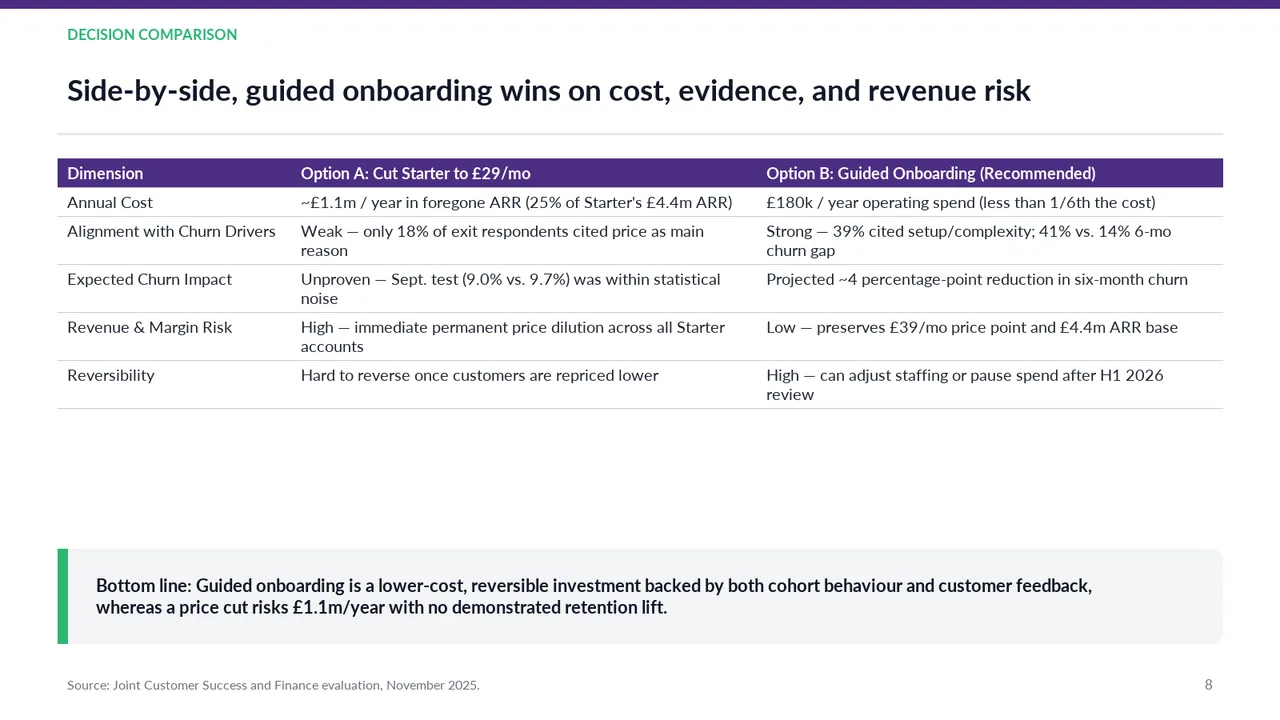
  8. Slide 8 of Gemini 4 Neon's deck
    Slide 8Download slide imageAcceptable The comparison table is prose-heavy, with limited visual emphasis distinguishing the recommended option.Large empty band between the table and the bottom-line box
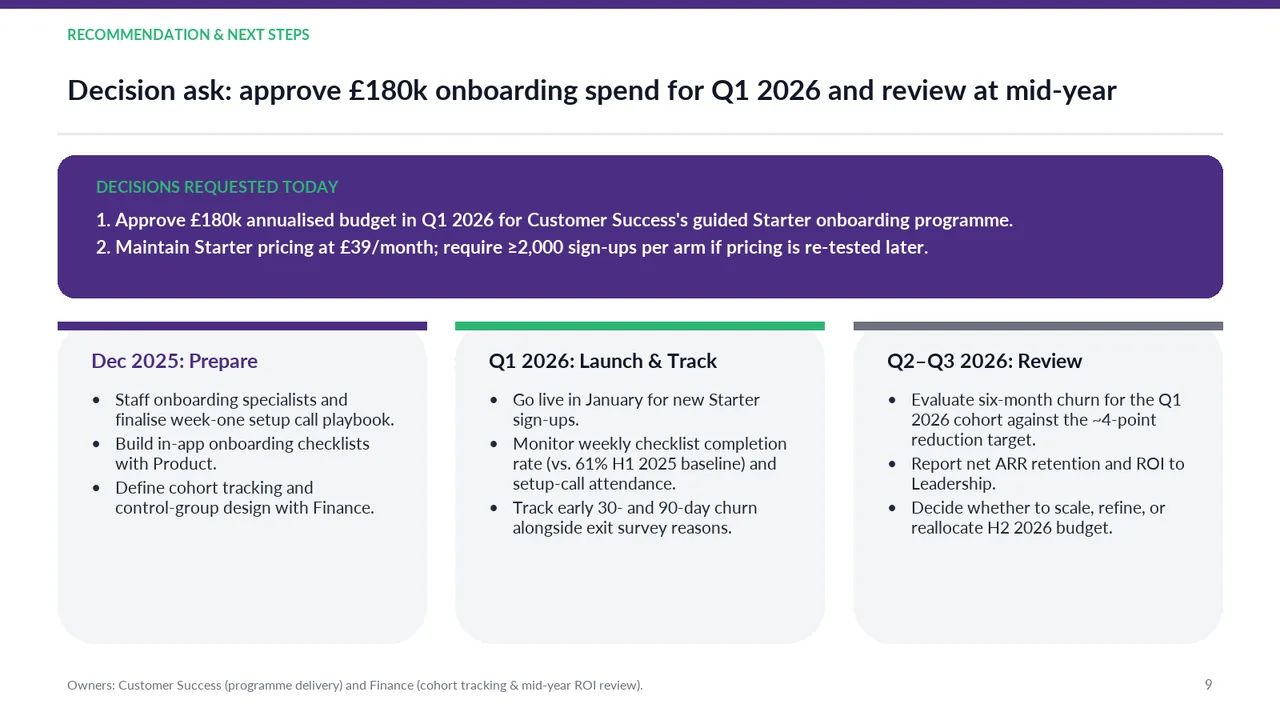
  9. Slide 9 of Gemini 4 Neon's deck
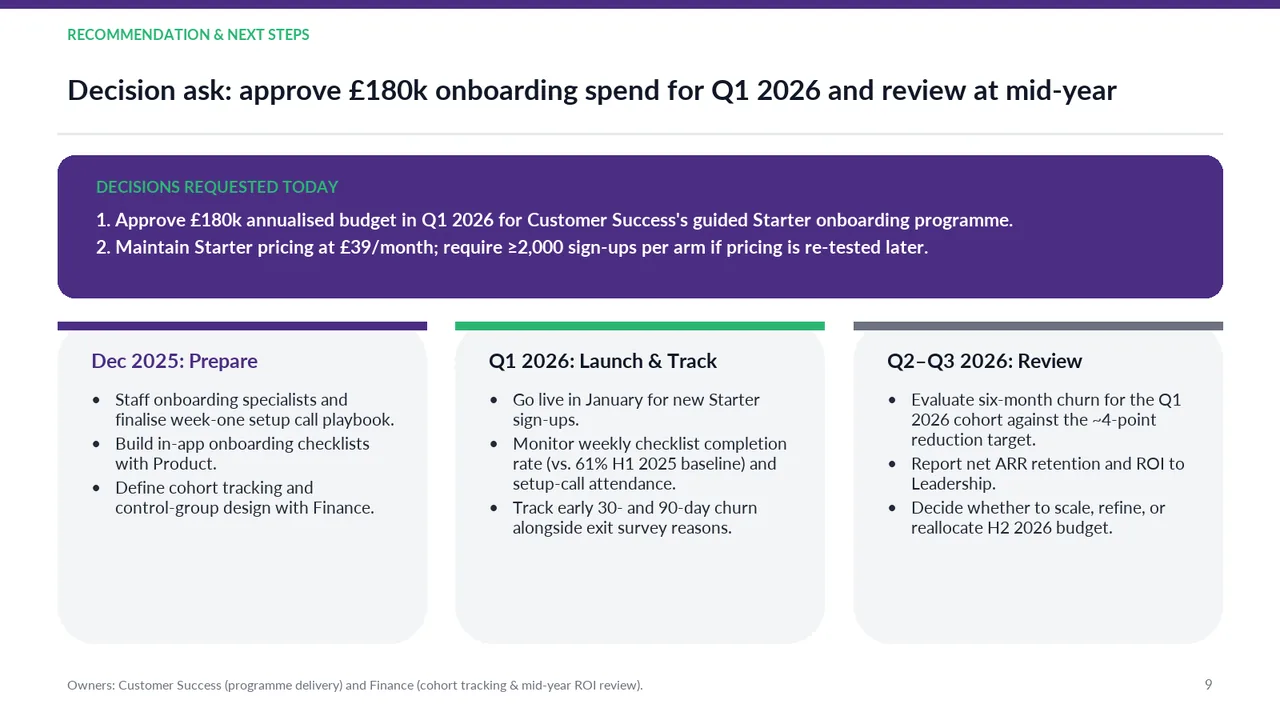
    Slide 9Download slide imagePolished The three phase cards rely on lengthy multiline bullets rather than concise milestones, reducing scanability.